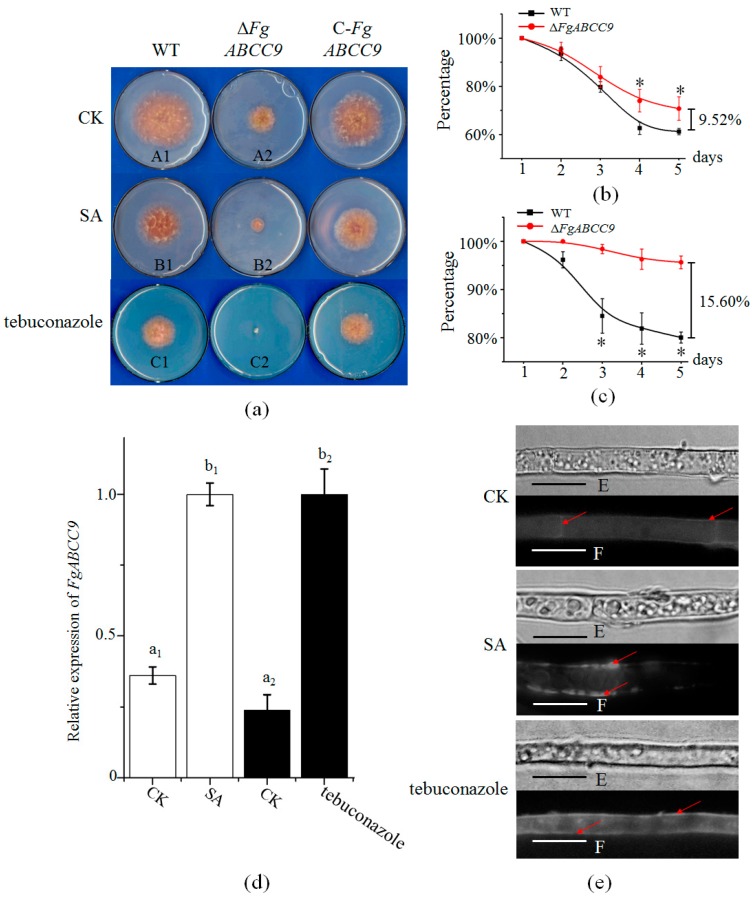
Figure 2.
Effect of FgABCC9 on mycelial growth. (a) Mycelial growth on mSNA (modified Synthetischer Nährstoffarmer Agar) plates with SA and tebuconazole. CK, control treatment. Plates were photographed on the fourth day post inoculation. (b) Percentage of mycelial growth inhibited by SA ([A1-B1]/A1 for WT, [A2-B2]/A2 for ΔFgABCC9). (c) Percentage of mycelial growth inhibited by tebuconazole ([A1-C1]/A1 for WT, [A2-C2]/A2 for ΔFgABCC9). Asterisks represent significance at p < 0.05. A1, B1, and C1 indicate mycelial areas of WT strain under the CK, SA, and tebuconazole treatments, respectively. A2, B2, and C2 indicate mycelial areas of ΔFgABCC9 under the CK, SA, and tebuconazole treatments, respectively. The experiments were repeated three times with 10 plates for each treatment. (d) Expression changes of FgABCC9 under SA and tebuconazole treatments in the WT strain. Different letters above each column indicate significance at p < 0.05. (e) Subcellular localization of the FgABCC9 protein. The fluorescent signal is marked with red arrows. E, Optical microscope. F, fluorescence microscope. Scale bar, 10 µm.

