Figure 4.
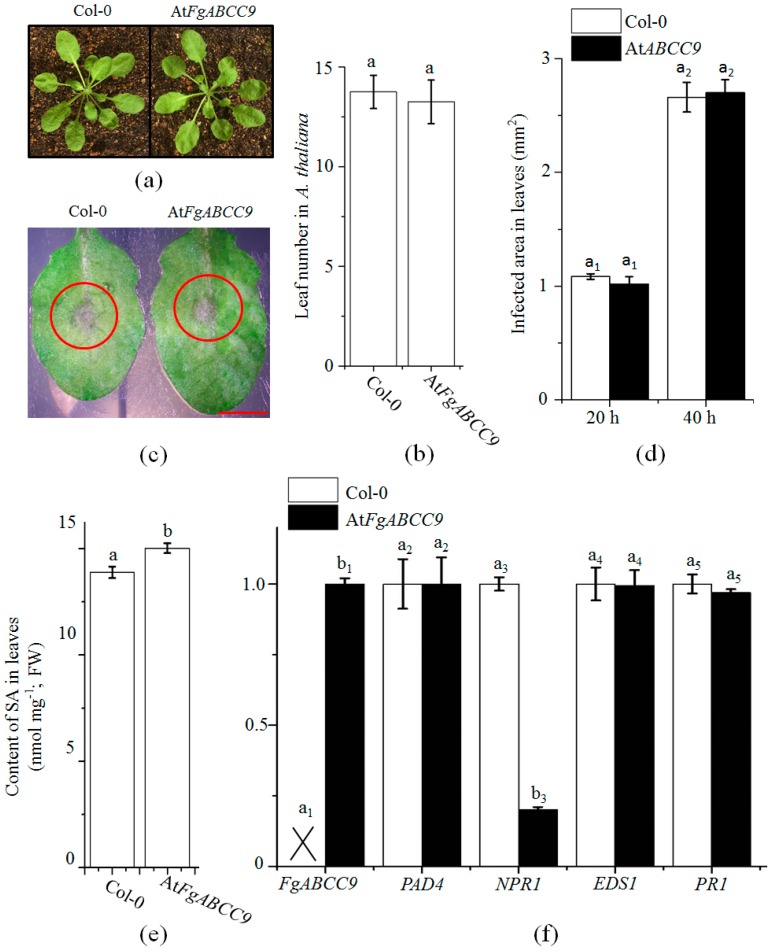
Evaluation of the function of FgABCC9 in A. thaliana. (a) The WT and AtFgABCC9 plants on the 30th day under SD condition. (b) Comparison of leaf numbers of WT and AtFgABCC9 plants as used in (a). (c) Comparison of visual disease symptoms in leaves of WT and AtFgABCC9 plants infected by F. graminearium at the 48th hour after inoculation. Scale bar, 1 cm (d) Comparison of infected areas in leaves at the 20th and 40th hour after inoculation. (e) Comparison of the contents of SA in leaves (without inoculation) of WT and AtFgABCC9 plants on the 30th day post germination under the SD (short day) condition. (f) Comparison of gene expression in leaves (without inoculation) of WT and AtFgABCC9 plants by qPCR. The cross indicates the absence of FgABCC9 from Col-0. Different letters above each column indicate significance at p < 0.05.

