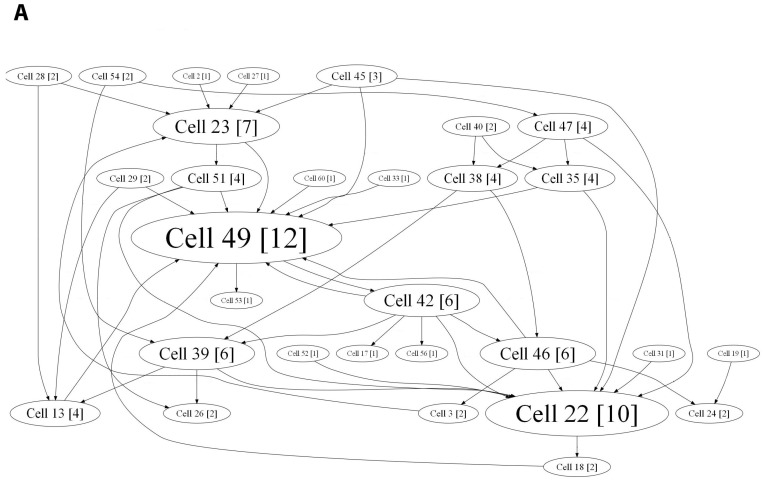
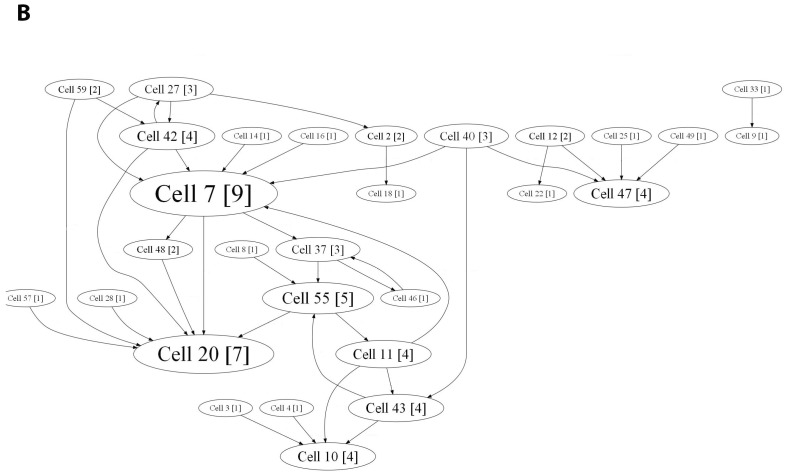
Figure 3.
Internal functional structure of neural networks in primary hippocampal cultures after AAV-BDNF-EGFP transduction. Graphical representation of the correlated connections among neurons in the network on 14 DIV. The electrode number is presented as “Cell X”. The number of connections on the electrode is indicated in square brackets. The vertex size is proportional to the number of significant connections. А—sham, B—AAV-Syn-BDNF-EGFP.


