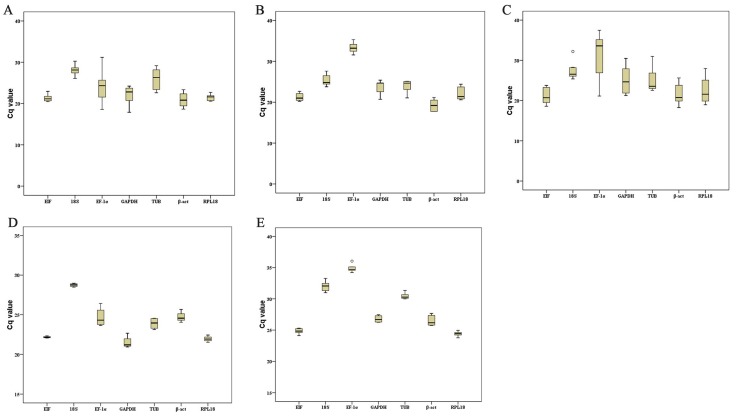
Figure 4.
Variation in the reference genes expression using Cq values with boxplot. (A) Different tissues in adult shrimps. (B) Five different ovary development stages. (C) Different embryo development stages. (D) Different times after hypoxia stress in gill. (E) Different times after infection in hepatopancreas. Upper and lower whiskers mean maximum and minimum values, except outliers, and using a circle to mark the mild outliers and an asterisk to mark the extreme outliers. The upper and lower edges of the box represent the upper and lower quartiles, the middle black line is the median, and the whiskers represent the maximum and minimum values. Mild and extreme outliers are marked by circles and asterisks, respectively. The length of each graphic reflects its variation.

