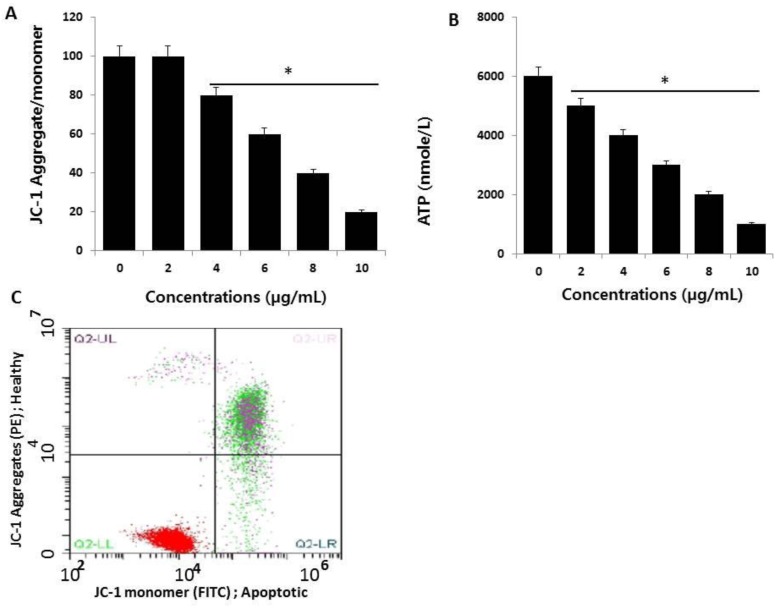
Figure 5.
Measurement of mitochondrial membrane potential (MMP) and ATP. (A) HCT116 cells were treated with AgNPs for 24 h. The change in MMP was determined using the cationic fluorescent dye, JC-1 (Molecular Probes, Eugene, OR, USA). (B) Flow cytometric analysis (FACS) of the mitochondrial membrane potential using the JC-1 dye in HCT116 cells treated with AgNPs (half maximal inhibitory concentration (IC50) 3 µg/mL) for 24 h. (C) The ATP level was measured according to the manufacturer’s instructions (Sigma-Aldrich, St. Louis, MO, USA; Catalog Number MAK135) in HCT116 cells exposed to AgNPs for 24 h. The results are expressed as the mean ± standard deviation of three independent experiments. There was a significant difference in the ratio of AgNP-treated cells compared to untreated cells, determined by a Student’s t-test (* p < 0.05).

