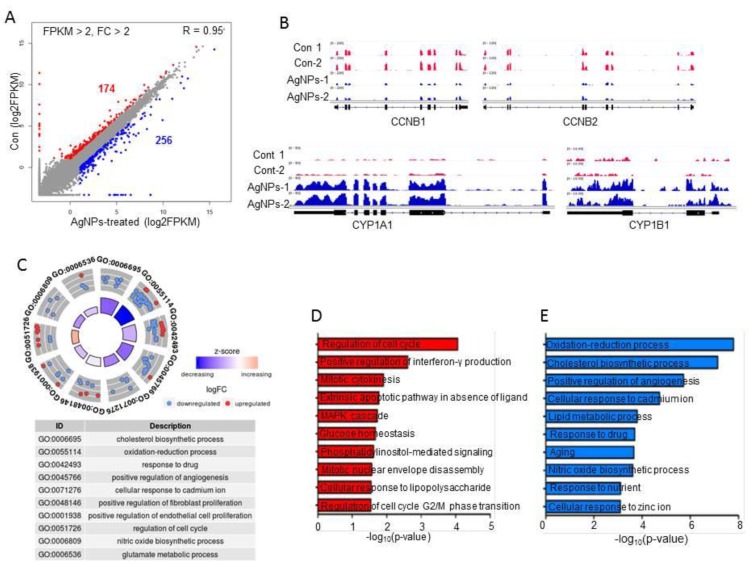
Figure 7.
Impact of AgNPs on gene expression. (A) Scatter plot showing up- and downregulated genes in AgNP-treated HCT116 cells. The log2 fragments per kilobase of transcript per million mapped reads (FPKM) values were used for plotting. Red and blue dots indicate downregulated and upregulated genes in AgNP-treated HCT116 cells, respectively. Cut-off: FPKM ˃2 and fold change ˃2. (B) Representative IGV images of down- (CCNB1 and CCNB2) and upregulated (CYP1A1 and CYP1B1) genes. (C) Gene Ontology (GO) term analysis using both up- and downregulated genes. Each red (downregulated) or blue (upregulated) dot represents one gene belonging to each term. (D,E) bar graphs showing GO terms of individual up- and downregulated genes.

