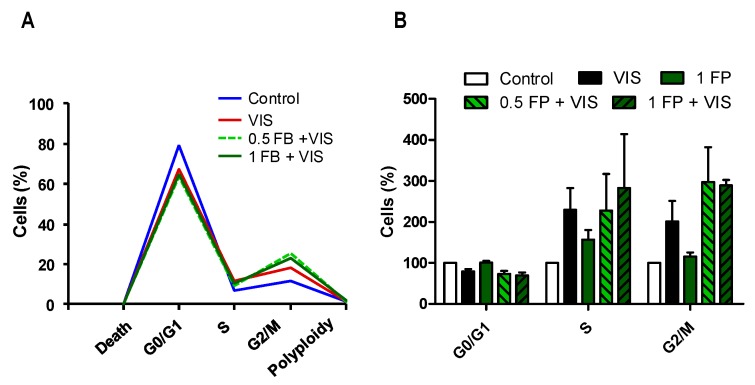
Figure 4.
Effects of VIS and FB+VIS on cell cycle. Cell cycle was evaluated 24 h after the indicated treatments by flow cytometry. (A) Percentage of cells in G0/G1, S and G2/M cell cycle phases, and percentage of cell death and polyploidy (representative graph); (B) analysis of G0/G1, S and G2/M cell cycle phases. VIS light dose: 247.3 J/cm2.

