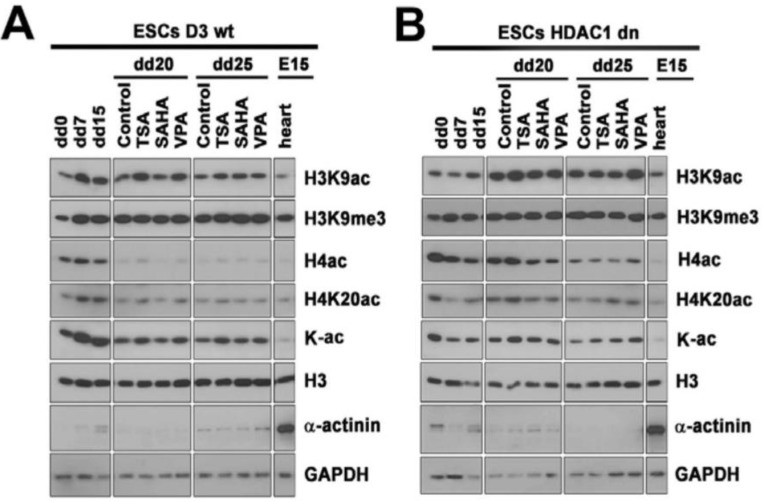
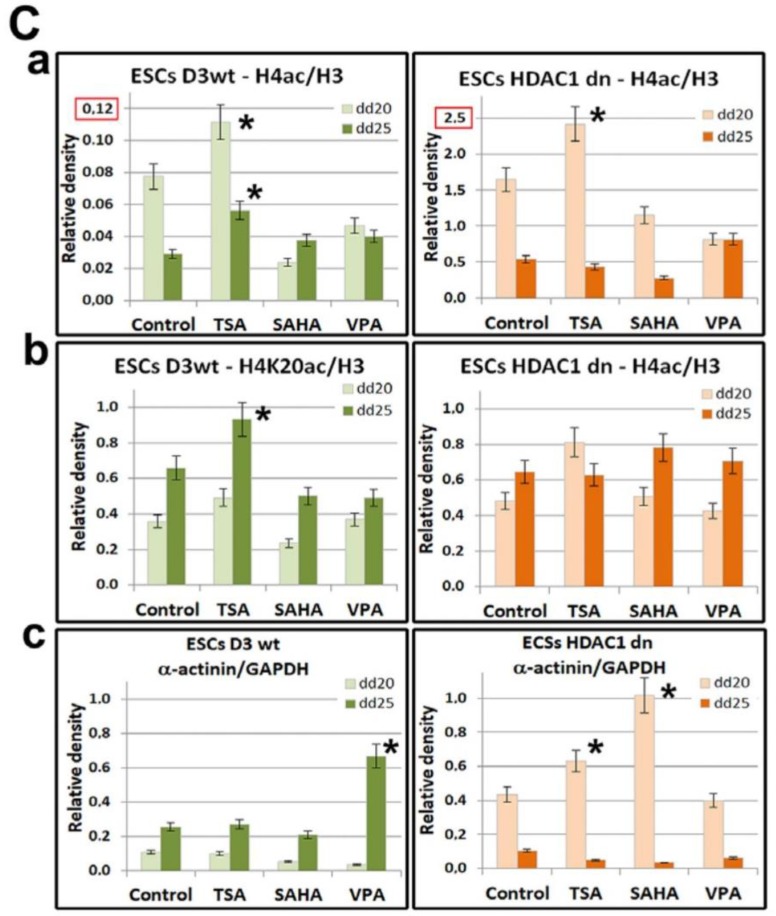
Figure 3.
Histone acetylation and methylation in HDAC1 wt and HDAC1 dn mESCs induced into cardiomyocytes and treated with HDACi. The level of H3K9ac, H3K9me3, H4ac, H4K20ac, pan-acetylated lysines (K-ac), and α-actinin in (A) HDAC1 wt mESCs and (B) HDAC1 dn mESCs. In three biological replicates, Western blots were performed on one gel. For the data presented in panel A or B, the gel was separated by Photoshop to show samples that were compared in one relevant subset. Data on histone levels were normalized to the level of histone H3 and non-histone proteins were normalized and quantified to the level of GAPDH (C). In wt and HDAC1 dn non-treated cells and in TSA-, SAHA-, or VPA-treated mESCs, panel (Ca) shows the levels of H4ac, (Cb) shows H4K20ac, and (Cc) shows the levels of α-actinin. The total protein levels were measured using a µQuant spectrophotometer for each sample, and an identical protein amount was loaded on the gels. In panel (A,B), the levels of histone markers are also shown for embryonic hearts (e15). Quantification of the protein levels in panel (C) was performed using ImageJ software (NIH, freeware). Statistical analyses were performed using Student’s t-test; asterisks (*) in panel (Ca–c) show statistically significant differences at p ≤ 0.05. Note that the y-axis-scale in panel (Ca) is different (red frames) for the wt and HDAC1 dn cells for technical purposes. In panel (Ca), the level of H4ac is significantly less in the wt mESCs when compared with the HDAC1 dn cells (Cb).


