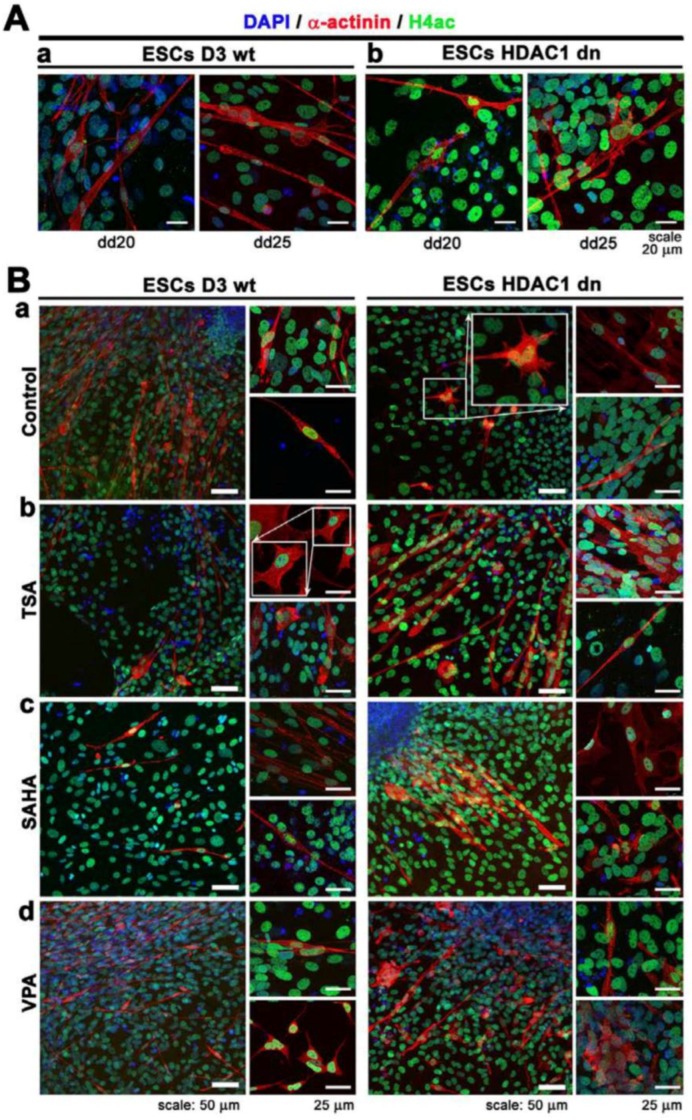
Figure 4.
Distribution pattern and levels of histone H4 acetylation (green) and α-actinin (red) in (Aa) wt mESCs and (Ab) HDAC1 dn mESCs differentiated at dd20 and dd25. Panel (Ba) shows non-treated wt mESCs and HDCA1 dn mESCs at dd25, and panels (Bb–d) show wt mESCs and HDCA1 dn mESCs treated by HDACi at dd25: (Bb) TSA treatment, (Bc) SAHA treatment, and (Bd) VPA treatment. DAPI (blue) was used as a counterstain of the cell nuclei.

