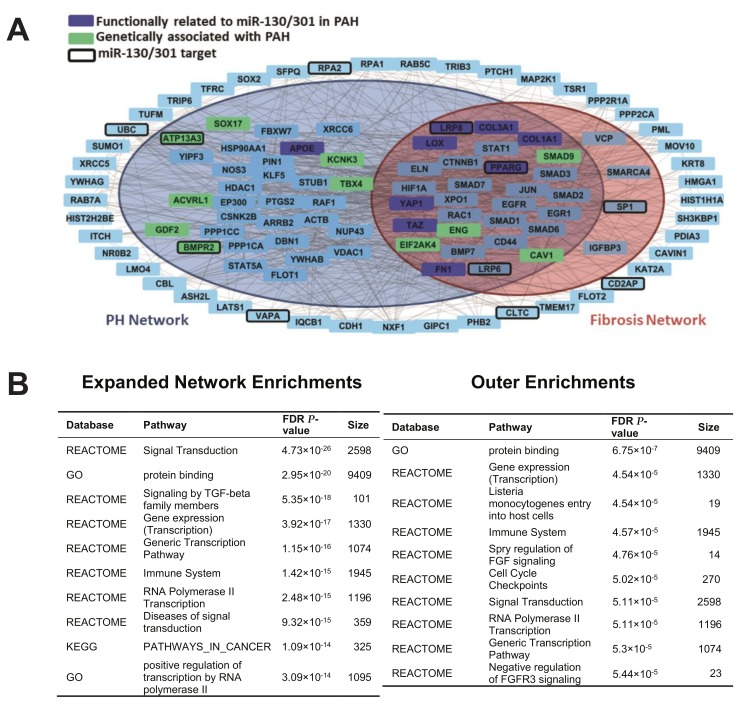
Figure 5.
A network bioinformatics approach predicts the complex and overlapping relationships among factors genetically associated with PAH with known miR-130/301 target genes, PH genes, and fibrosis genes. (A) Network model. Gray lines indicate an interaction between two genes. Genes in dark blue are functionally related to miR-130/301 members in PAH, and genes in green are associated with heritable PAH. Genes with a thickened border are predicted targets of miR-130/301 in TargetScan [21]. Genes found in the larger blue circle are common to the PH Network, and those found in the orange circle are common to the Fibrosis Network. (B) In the left table, top-ranked pathways via gene set enrichment analysis (GSEA) are listed of genes found in the PH and Fibrosis Networks interacting with known miR-130/301 target genes and factors genetically associated with PAH (e.g., genes located in the inner colored circles of (A)). In the right table, top-ranked pathways are listed of genes interacting with miR-130/301 target genes and factors associated with heritable PAH found outside the PH/Fibrosis Networks (e.g., genes located outside the colored circles of (A)).

