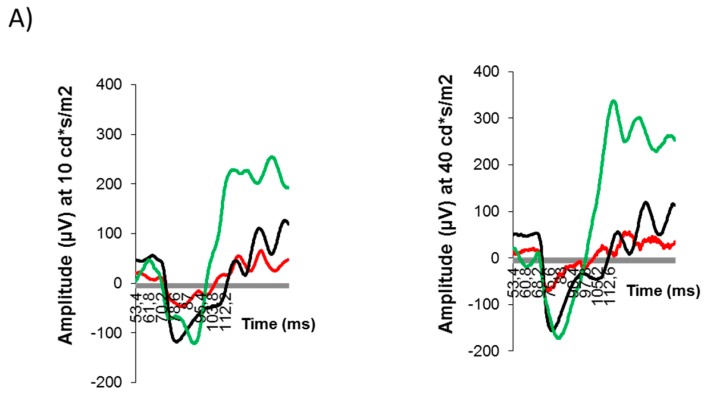
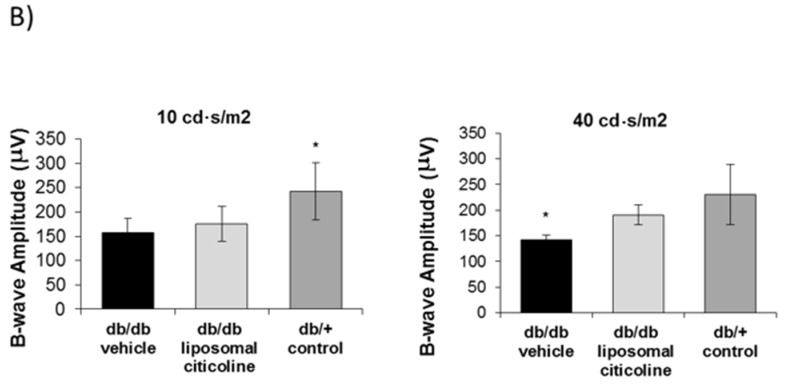
Figure 5.
Effect of citicoline on electroretinography (ERG)abnormalities. (A) ERG traces in response to low (10 cd·s/m2) and medium (40 cd·s/m2) stimulus intensities in a representative mouse of each investigational group. Red line: db/db-vehicle. Black line: db/db-citicoline. Green line: db/+ (non-diabetic control); (B) quantitative analyses of amplitude of b-wave in db/db treated with vehicle, db/db treated with citicoline, and non-diabetic mice. Results are mean ± SD. * p < 0.05 in comparison with the other groups.


