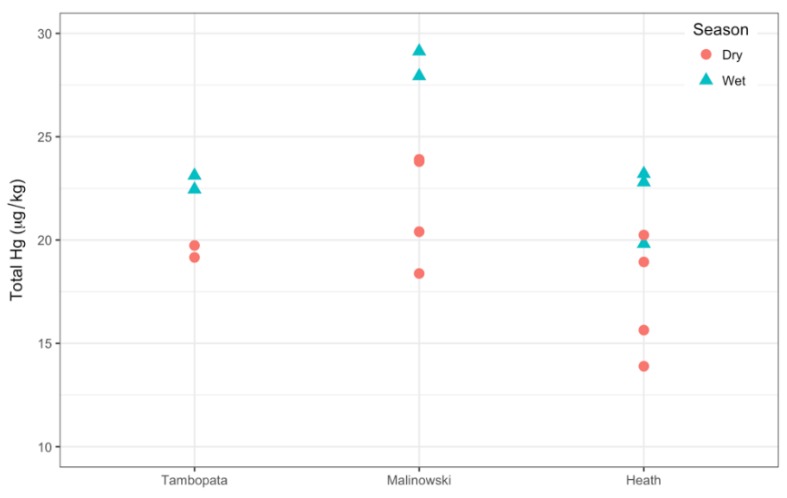
Figure 3.
The % C-normalized Hgsed (μg/kg) for each river. Dry season Hgsed are shown with circles and wet season Hgsed are shown with triangles. All wet season Hgsed are higher than dry season Hgsed for each river, except one value in Heath River. An outlier collected directly from an ASGM-site was not included (Malinowski River = 367.2 μg/kg).

