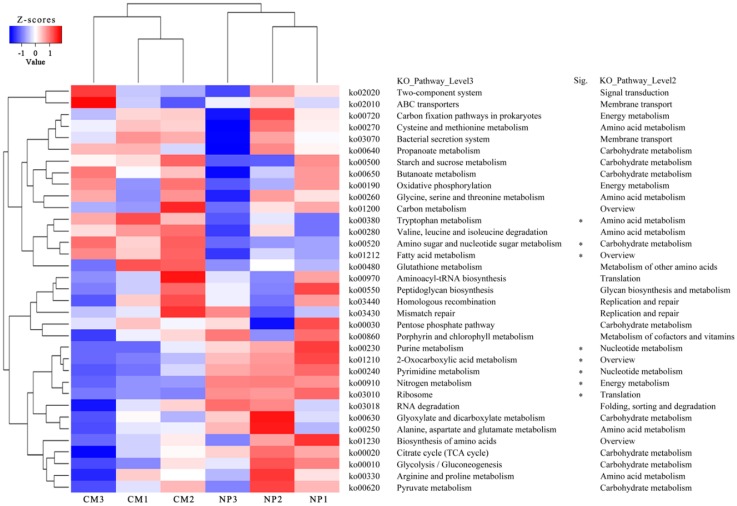
Figure 5.
Heat map analysis of the top 35 most abundant KEGG pathways in at least one soil sample using normalized abundance. Heat map is color-coded based on row z-scores. The metabolic pathways assigned to “Organismal Systems” and “Human Diseases” on KEGG database were excluded. NP and CM represent the one-year cultured soil and two-year consecutively monocultured soil, respectively. Sig. represents significant differences for level 3 KEGG pathways between two different treatments (* q < 0.12).

