Figure 1.
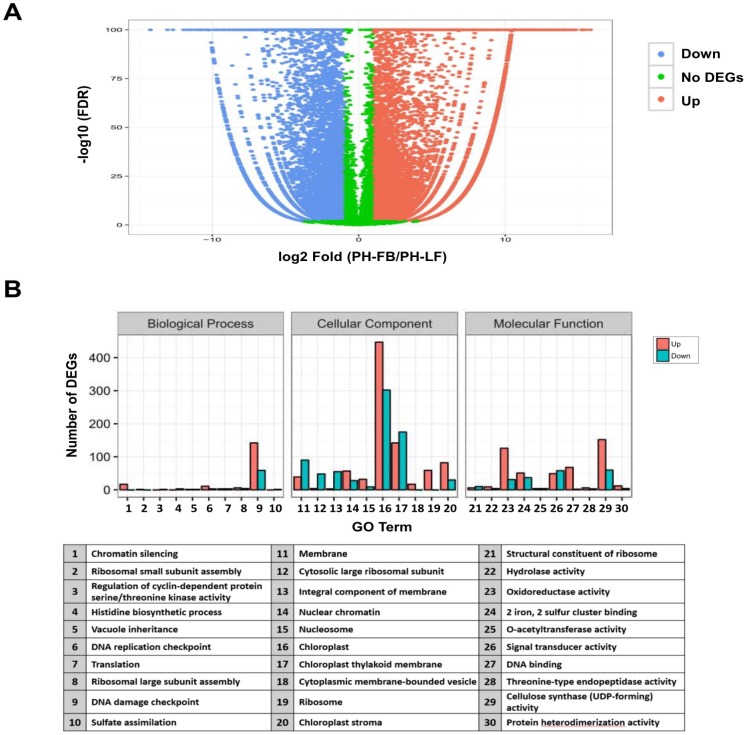
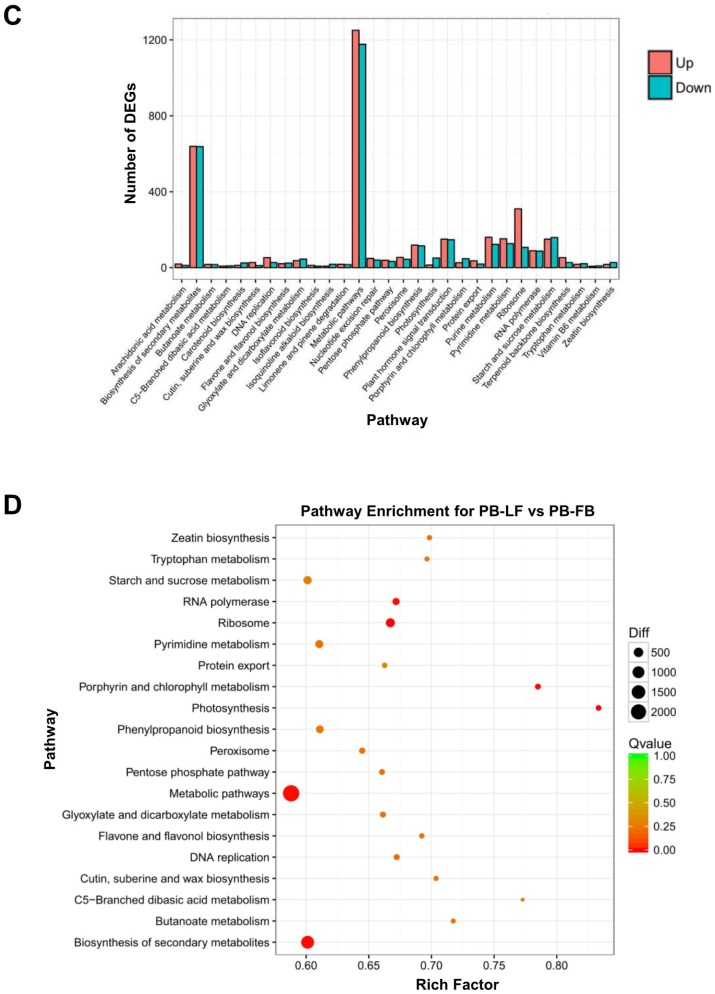
Statistics of all comparison among differentially expressed genes (DEGs) in GO and KEGG enrichment analysis. (A) Volcan plot for the distribution of DEGs. The differences in expression between PH-FB (developing floral buds) and PH-LF (mature leaves) were analyzed by using the FDR ≤ 0.001 and a fold change (the ratio of PH-FB/ PH-LF, log2) ≥ 2 as the criteria to screen DEGs. Each dot represents a unigene, and red and blue dots indicate DEGs that are up- and down- regulated, respectively. The green dots represent unigenes with no DEGs changes in these two samples. (B) Histogram of the DEGs number (up and down) in the enriched GO terms. These GO terms were classified into Biological Process, Cellular Component, and Molecular Function groups. (C) Histogram of the DEGs number (up and down) in the most enriched pathways. The most enriched pathways (30 terms) were selected, and statistics according to the up- and down- regulation of DEGs were compared with the controls. (D) The scatter plot from the results of DEGs enriched pathways. The Y-axis shows the top 20 enriched KEGG pathways. These 20 pathways were sorted with the increasing significant level from the bottom to the top on the Y-axis. The X-axis indicates the enrichment factor (the enriched gene number is proportional to the background gene number) for each enriched pathway. The larger points correspond to more DEGs numbers and the different colors of points show the different Q values.


