Figure 1.
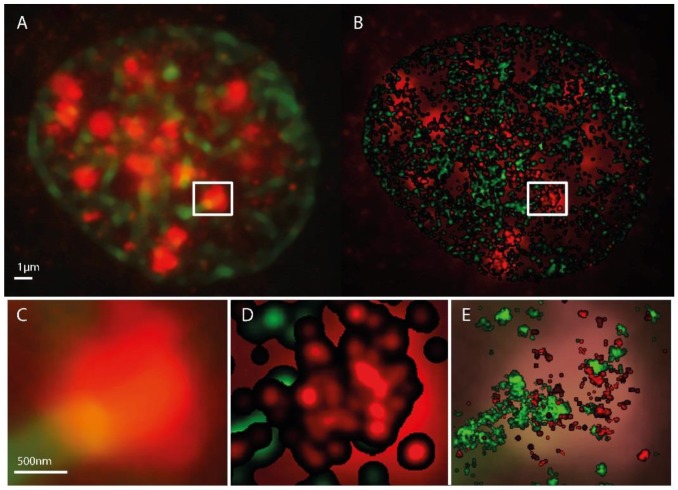
Microscopy images of H3K9me3 (green) and γH2AX (red) immunostaining in a SkBr3 cell nucleus 30 min after irradiation with 1 Gy, 6 MeV photons. (A) conventional widefield microscopy image. (B) SMLM image represented as a density image where the brightness of a point refers to the number of next neighbor points. In the background the conventional widefield microscopy image of γH2AX fluorescence is shown. The SMLM image is created from the coordinate matrix where the pixel geometry and intensity is stored in pixel values. After determination of the pixel size in nm, the coordinates and distances can be evaluated. In a fixed radius R around each coordinate, it is determined how many further coordinates are within this radius. This value is coded in the intensity of the coordinate point. In order to emphasize contiguous structures, each coordinate with an assigned value greater than zero is the starting point of a Gaussian distribution with a given sigma. The sum of all Gaussian distributions then represents the intensity distribution of the Gaussian-filtered density image (example: pixel size = 10 nm/pixel, Radius R = 1000 nm, Gaussian filter σ = 50 nm). (C) magnified insert from (A). (D) magnified insert of (B). (C,E) superposed by the standard localization image. This supposing image is directly created from the localization data. In-homogeneities and sub-structures within the γH2AX cluster are visible. Again a pixel size has to be determined. Here, every coordinate is starting point of a Gaussian distribution with the localization precision as sigma (pixel size = 10 nm/pixel).

