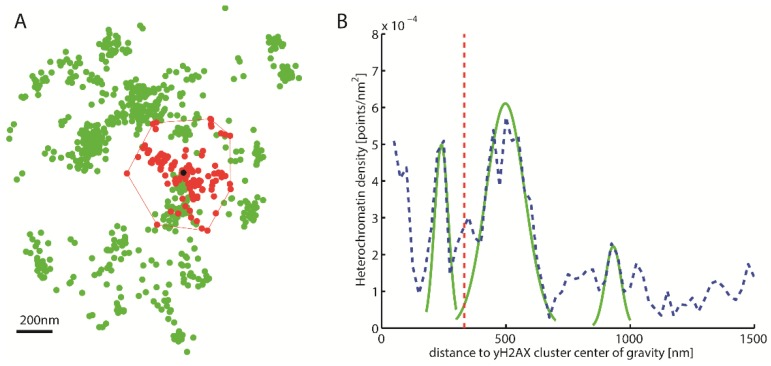
Figure 2.
Density distribution around γH2AX cluster. (A) Schematic representation of a γH2AX cluster (red) recognized by Density-Based Spatial Clustering of Applications with Noise (DBSCAN), the center of gravity (black) and the heterochromatin (green) around it. (B) Density distribution of heterochromatin around the γH2AX cluster center of gravity (blue). This density distribution is used to classify whether a cluster is heterochromatin-associated. For this purpose, the local maxima are approximated by Gaussian functions (green). The amplitude of these maxima is then compared with the predetermined threshold value. The red line represents half the mean square distance of the convex hull of the cluster (i.e., a kind of “radius” of the cluster).

