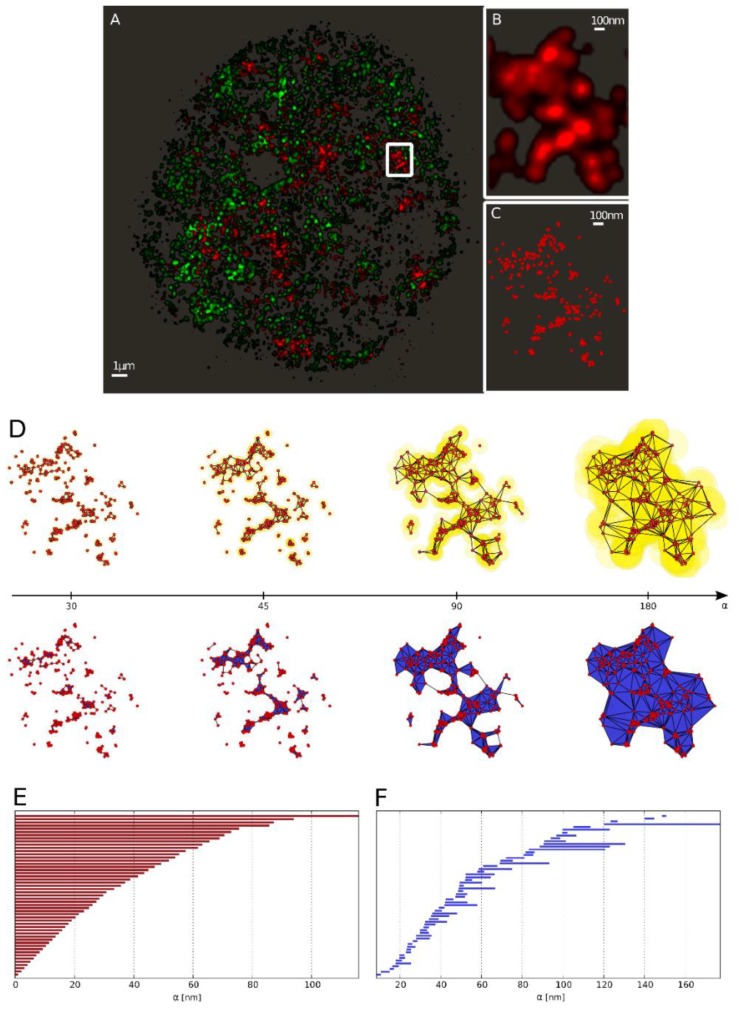
Figure 3.
From the single molecule localization microscopy (SMLM) data to the barcode representation. (A) Full view of heterochromatin (green; labeled by antibodies against H3K9me3) and γH2AX labeling (red) of a SkBr3 cell nucleus 30 min after irradiation with 2 Gy depicted as a density image. (B) Zoom-in into the marked γH2AX cluster. (C) Scatter plot of the marked γH2AX cluster (every point represents a detected fluorophore). (D) Components of the α-shape filtration of the marked γH2AX cluster exemplarily depicted at α = {30, 45, 90, 180} nm (left to right). As the growing spheres mutually embed the center of each-other the corresponding centers are connected by an edge (as shown in the upper row). Whenever a triangle is formed, it is included in the solid as a face element (illustrated in the lower row). (E) Barcodes of dimension 0 (Betti number) corresponding to connected components. (F) Barcodes of dimension 1 (Betti number) corresponding to holes.

