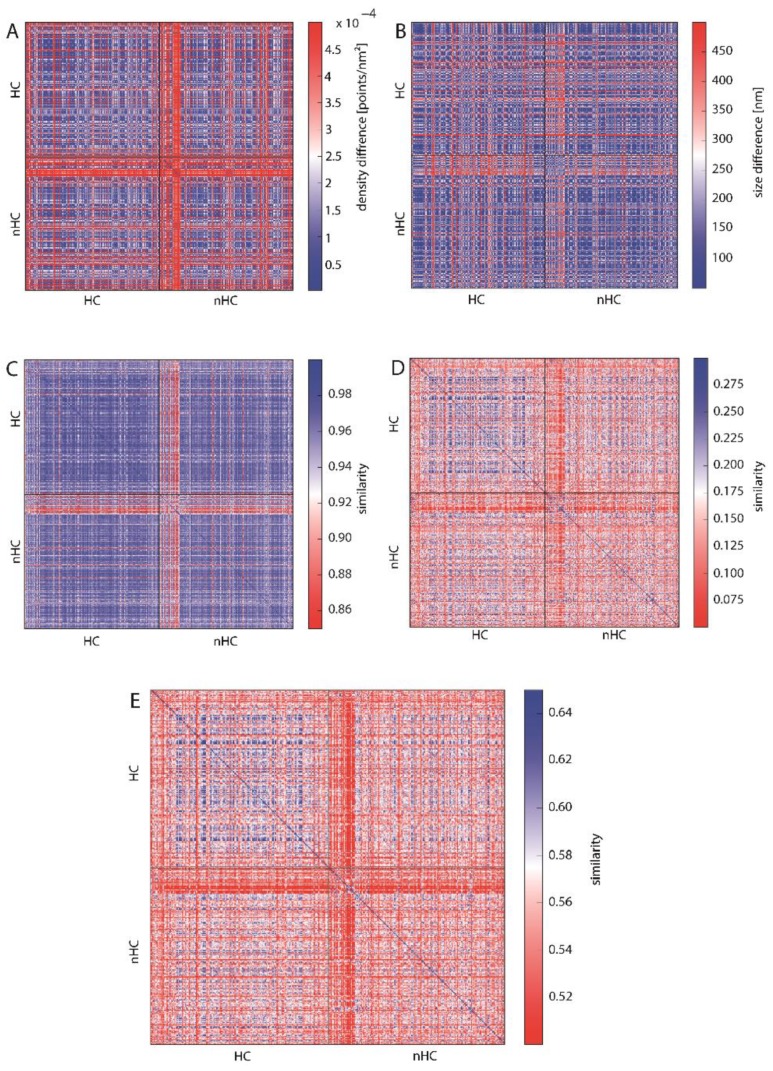
Figure 5.
Heat maps depicting the similarity of HC- and nHC-associated γH2AX clusters according to (A) cluster density, (B) cluster size indicating a high similarity (see also Figure S2), (C) topological similarity of the connected components (“lines”), (D) topological similarity of the “holes”, (E) average topological similarity. The spectrum of the color bar of all the heat maps ranges from red representing dissimilarity between the analyzed clusters to blue depicting similarity.

