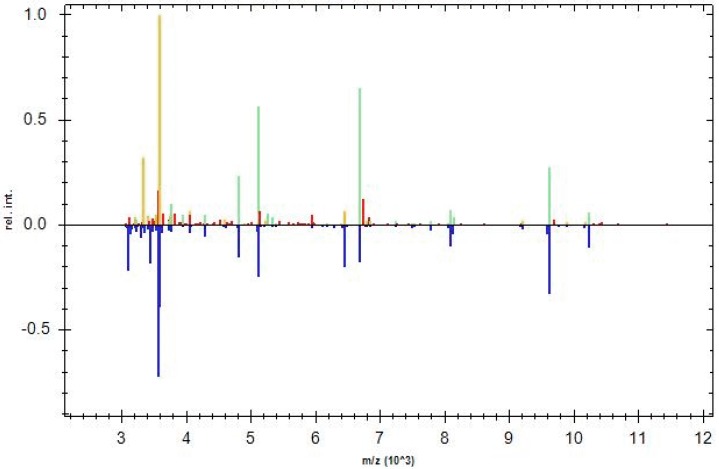
Figure 5.
Graphic representation of identification of S. epidermidis (clinical strain) as S. epidermidis non-biofilm producer. In the upper half of the graph, the normalized peak list spectrum of the unknown sample is shown (S. epidermidis SE08). In the lower half of the graph, the peak list spectrum of the MSP related to S. epidermidis 12,228 selected by MALDI Biotyper 3.0 is shown.

