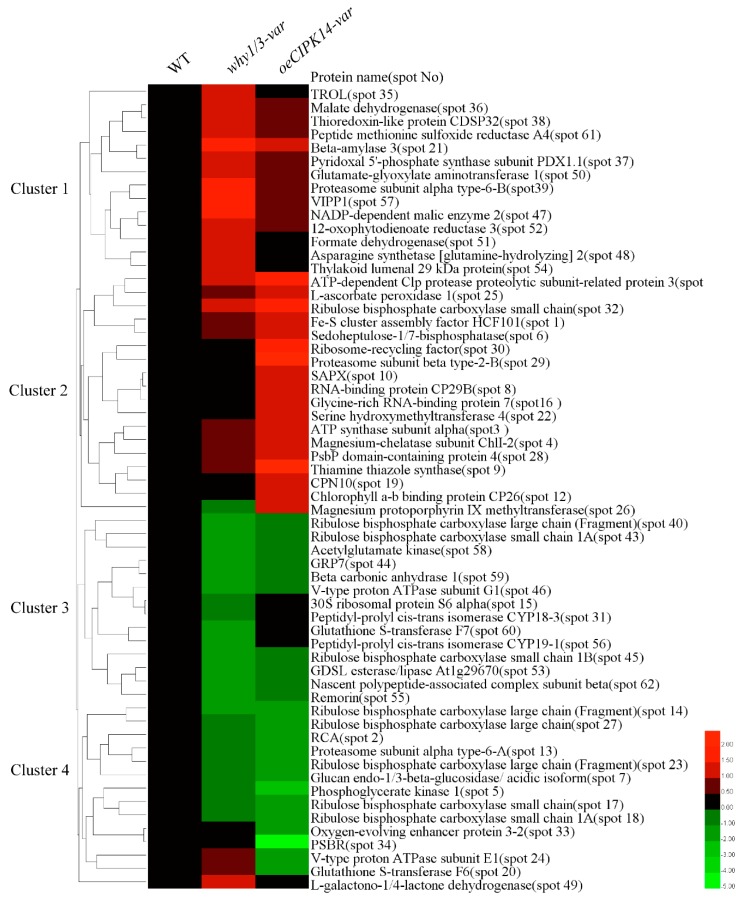
Figure 3.
Hierarchical cluster analysis of the differentially expressed proteins of why1/3-var and oeCIPK14-var compared with WT. The three columns represent protein expression changings in the (A) WT, (B) why1/3-var, and (C) oeCIPK14-var, respectively. The rows represent individual proteins identified in the why1/3-var and oeCIPK14-var lines; the up-regulated or down-regulated proteins are indicated in red or green. The heat map used log2 of fold changes of protein abundance between WT and why1/3-var and oeCIPK14-var mutants.

