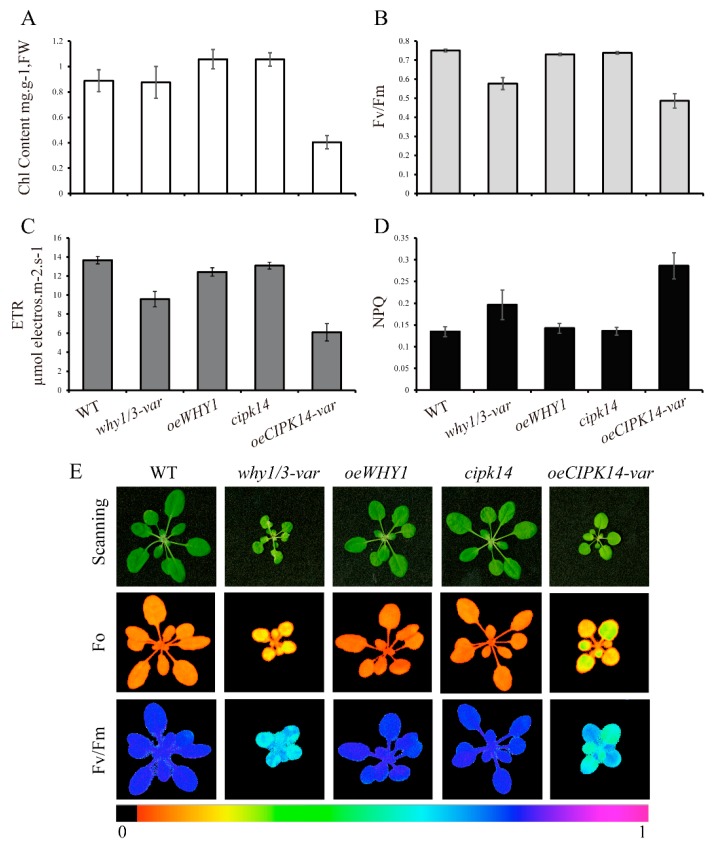
Figure 6.
The photosynthetic performance analysis of WHY and CIPK14 mutants. (A) Total chlorophyll content; (B) The maximum photochemical efficiency of photosystem II (Fv/Fm); (C) The nonphotochemical quenching of photosystem II fluorescence (NPQ); (D) The electron transport rate (ETR). The error bars indicate the standard error of nine independent measurements; (E) The fluorescence images of the whole plants of WHY and CIPK14 mutants. The fluorescence images are taken by Image-PAM using the plants after being dark-adapted 30 min.

