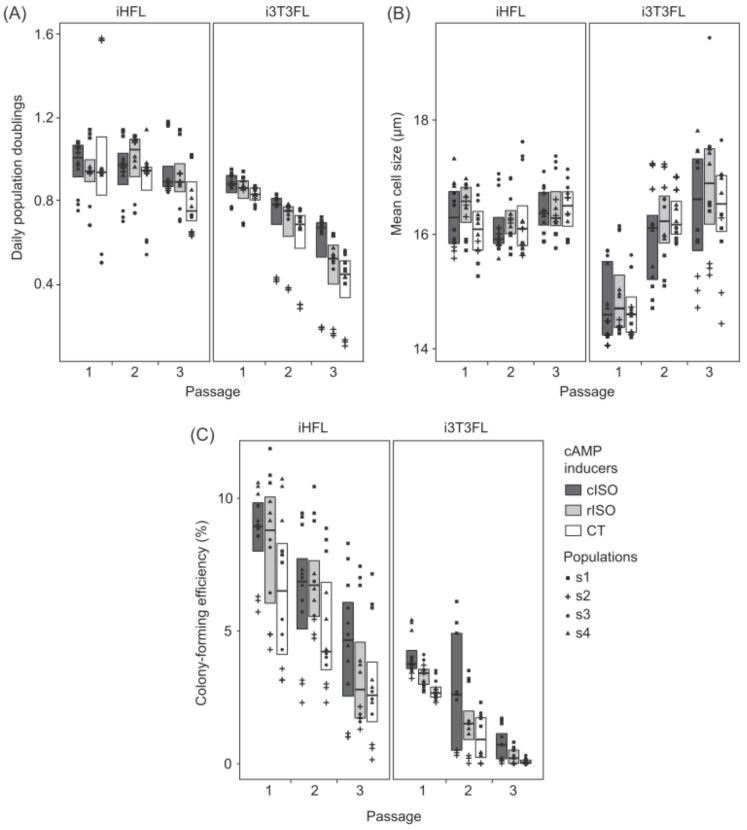
Figure 1.
Box plots illustrating differences in (A) daily population doublings, (B) mean population cell size, and (C) colony-forming efficiency. Box plots show Q1 (quartile 1), median value, and Q3 (quartile 3). Triplicate values are shown as an overlaying dot plot. Keratinocyte populations (s1 to s4) are identified with symbols (s1: square, s2: cross, s3: circle, and s4: triangle). Box plot fill colors show what cAMP inducers were used (cISO: dark gray, rISO: light gray, and CT: white). Left panels show human keratinocytes co-cultured with irradiated human dermal fibroblast feeder layer (iHFL) and right panels those co-cultured with irradiated Swiss murine embryonic fibroblast feeder layer (i3T3FL).

