Figure 4.
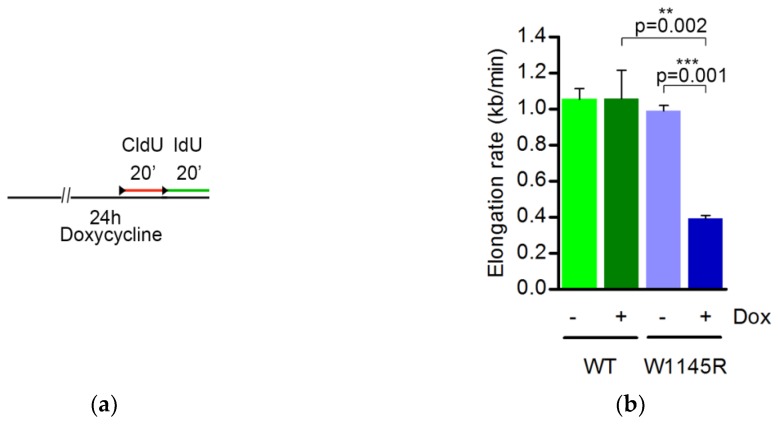
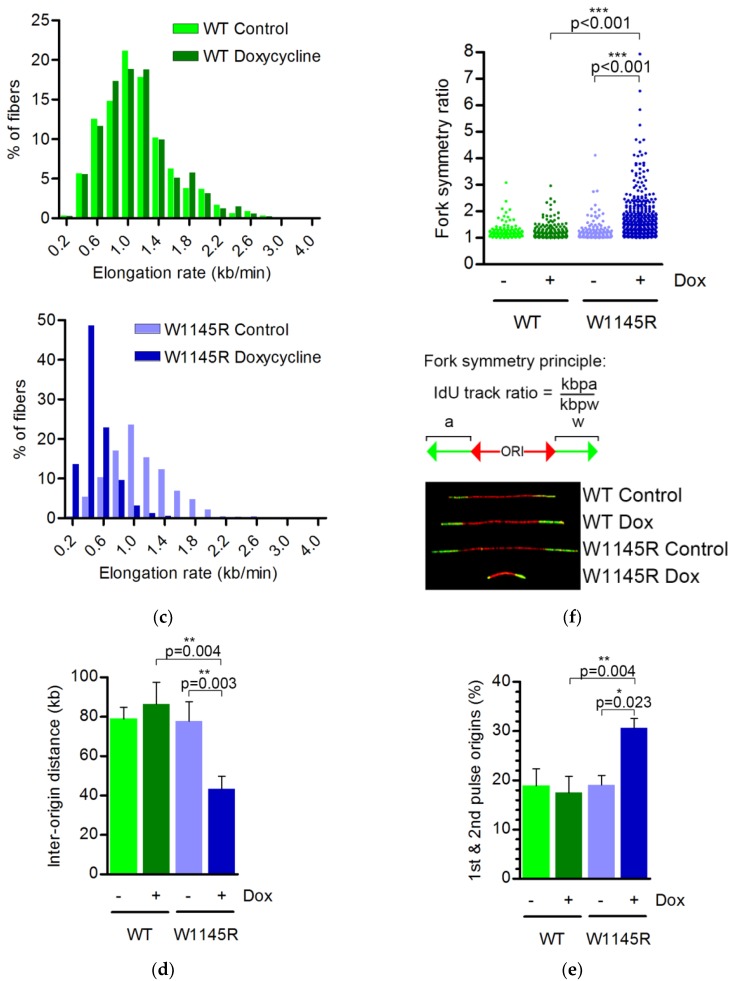
Expression of eGFP-TopBP1 W1145R but not WT causes strong DNA replication stress. (a) Scheme for the DNA fiber assay; (b) DNA replication fork elongation rate (kb min−1); (c) The distribution of elongation rate data from panel B; (d) Distance between origins (kb); (e) Percentage of new origins initiated during both pulses; (f) Whisker plot showing fork symmetry ratios in individual fibers. The principle for counting fork symmetry ratios, and examples of representative fibers are shown. For this analysis, we used longer labeling times (45 min instead of 20 min) as it gives longer tracks which are easier to measure. Mean values and standard deviations are shown in panels (b,d,e). The data are from three technical repeats from two independent experiments. For each experiment, 129 to 953 fibers were scored. Statistical significance was calculated using paired samples (when comparing W1145R −Dox vs. +Dox) or unpaired samples (WT +Dox vs. W1145R −Dox) two-tailed Student’s t-tests in panels (b,d,e), and a Mann–Whitney test in panel (f), using the averages of the individual experiments. *, ** and *** indicate p values below 0.05, 0.005 and 0.001, respectively. Representative images of DNA fibers are presented in Figure S1.


