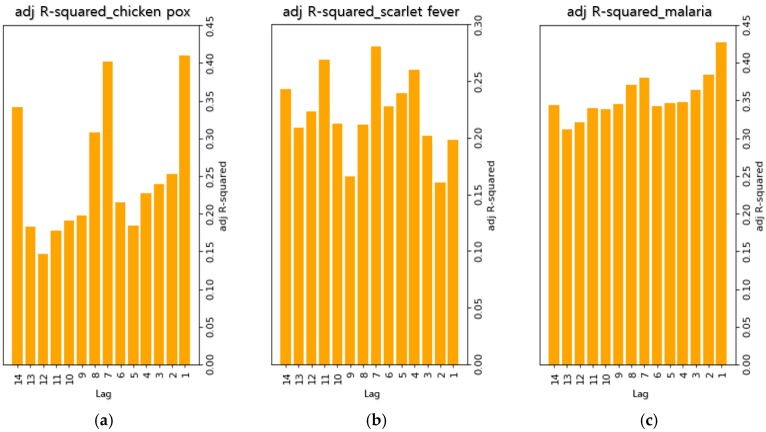
Figure 3.
Adjusted R-squared for each lag. (a) Adjusted R-squared values of regression models that applied lag of 1–14 days in chickenpox, (b) Adjusted R-squared values of regression models that applied lag of 1–14 days in scarlet fever, (c) Adjusted R-squared values of regression models that applied lag of 1–14 days in malaria.

