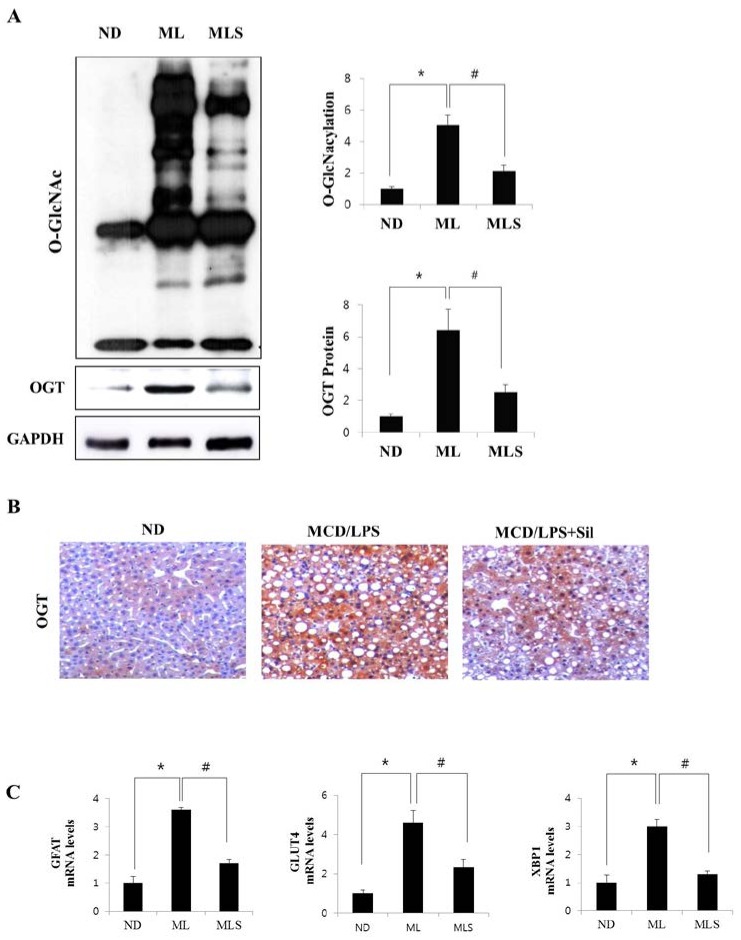
Figure 3.
O-GlcNAcylation and the expression levels of the proteins associated with the HBP pathway. (A) The upper panel shows the hepatic expression levels of O-GlcNAcylation in ND, MCD/LPS, or MCD/LPS + silibinin groups. The middle and lower panels represent the relative expression levels of OGT and GAPDH, respectively, as observed by immunoblotting. In the two graphs on the right, the intensity of O-GlcNAcylation and OGT was determined by densitometry. Data are representative of three independent experiments. (B) Liver sections of ND, MCD/LPS, or MCD/LPS + silibinin-fed mice were subjected to immunohistochemical analysis with antibodies against OGT. ×200 magnification. (C) Relative expression levels of the proteins associated with the HBP pathway were determined by qRT-PCR analysis. Differential levels of GFAT, GLUT4, and XBP1 mRNA are shown as fold-increase. Gene expression was normalized to 18 s RNA as an internal standard, and the data were presented as the mean value ± SE of seven samples. * p < 0.05 vs. ND group, and # p < 0.05 vs. MCD/LPS group.

