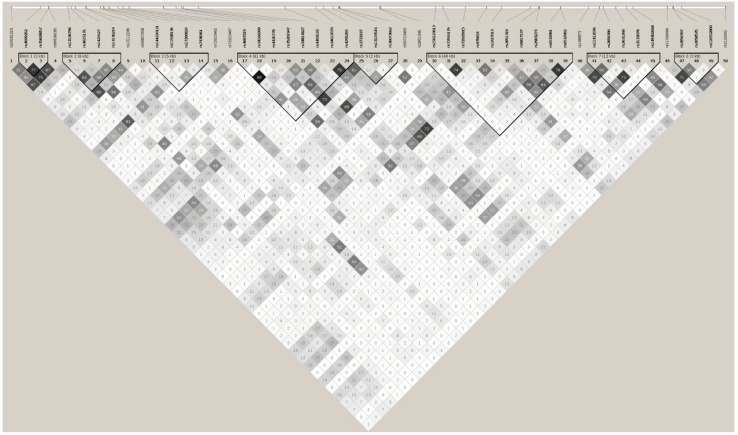
Figure 4.
Haplotypic architecture of BANK1 in AA. Plot representing pairwise r² values. Fifty tagging markers captured all 260 (100%) alleles at r2 ≥ 0.8, representing their 50 respective linkage groups in the AA sample. These 50 markers were organized in 8 haplotypic blocks and 11 independent signals. Calculation of haplotypic blocks was made using D’.

