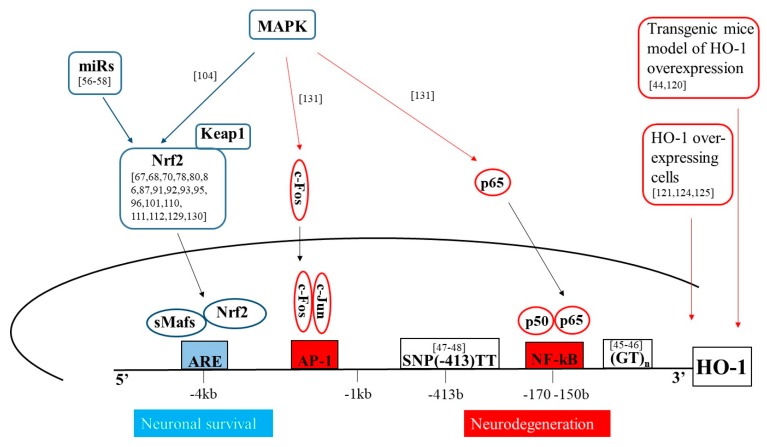
Figure 2.
Schematic representation of the main pathways involved in HO-1 mediated neuroprotection or neurodegeneration. The blu arrows and shapes represent signal pathways involved in HO-1 regulation in neuronal survival; the red arrows and shapes represent signal pathways involved in HO-1 regulation in neurodegeneration.

