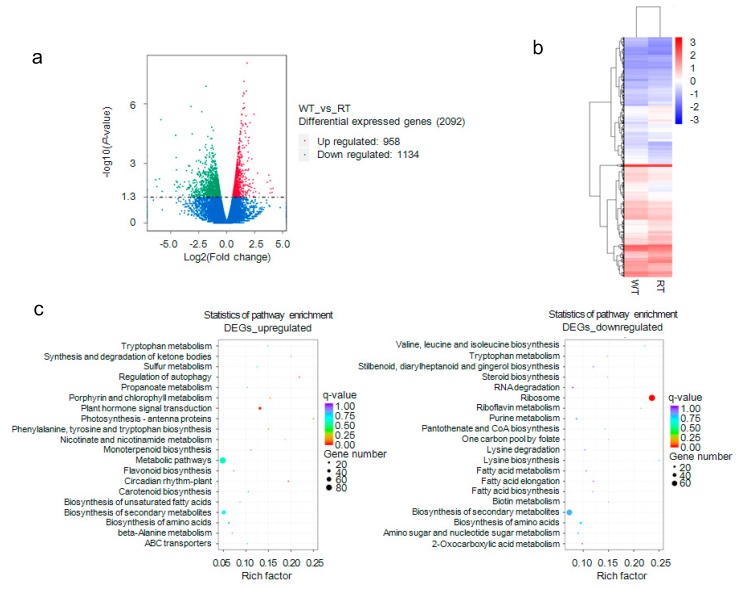
Figure 5.
Analysis of differentially expressed genes (DEGs). (a) Detection and distribution of genes differentially expressed between white petal tissues (WT) and red petal tissues (RT). Green and red dots indicate upregulated and downregulated DEGs, respectively. (b) Cluster dendrogram of DEGs. (c) Kyoto Encyclopedia of Genes and Genomes (KEGG) pathway enrichment of upregulated and downregulated DEGs.

