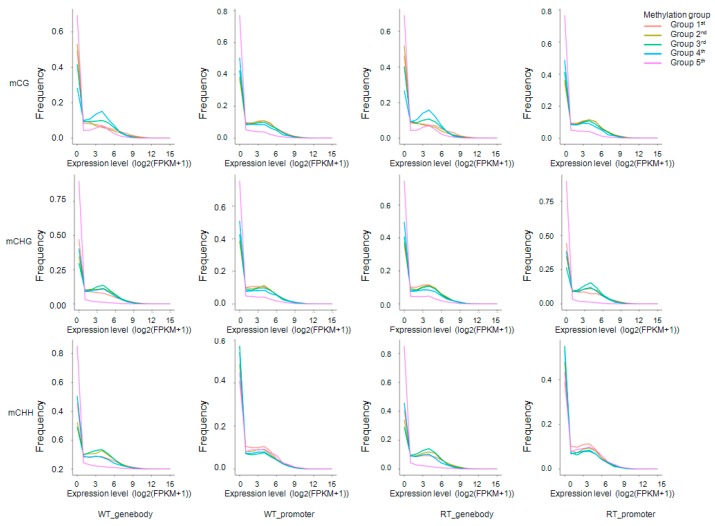
Figure 7.
Frequencies of expressed genes anchored by methylation sites within gene bodies and promoters. For each methylation sequence context (mCG, mCHG and mCHH), expressed genes were divided into five groups according to methylation level: group 1 (red; methylation level < level_20%); group 2 (yellow-green; level_20% ≤ methylation level < level_40%); group 3 (green; level_40% ≤ methy_level < level_60%); group 4 (blue; level_60% ≤ methy_level < level_80%); group 5 (pink; methy_level ≥ level_80%). Level_20%, _40%, _60%, and _80% represent values at the boundaries of the 20th, 40th, 60th, and 80th percentiles of methylation levels. WT and RT indicate white petal tissues and red petal tissues, respectively. The x and y-axes represent gene expression levels and gene frequencies, respectively.

