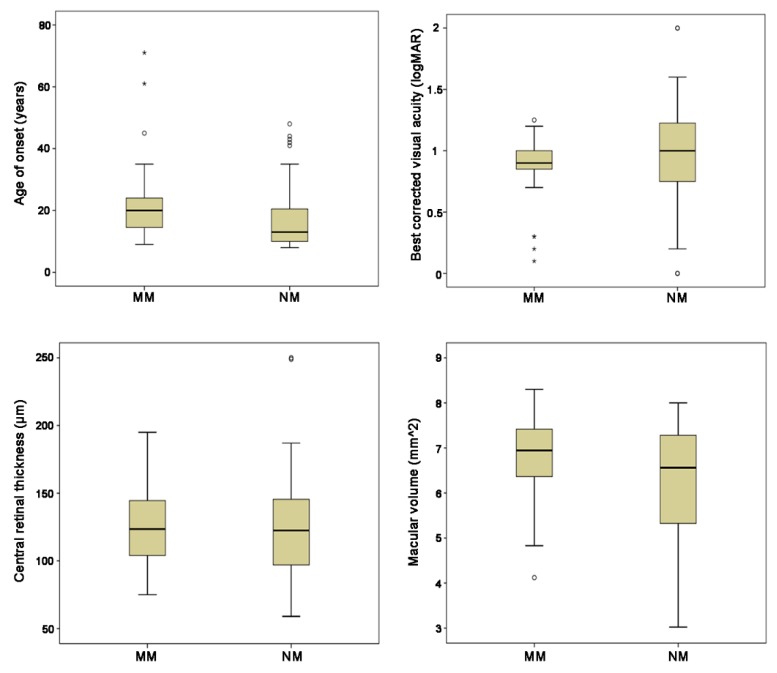
Figure 3.
Box-plots showing the comparison of age of onset (AO), best corrected visual acuity (BCVA), central retinal thickness (CRT), and macular volume (MV) for the two genotype groups (patients with at least one null mutation (NM) and patients with two or more missense variants (MM)). The dark line in the middle of the boxes is the median; the bottom of the box indicates the 25th percentile while the top of the box represents the 75th percentile. The T-bars that extend from the boxes represent the minimum and maximum values when they are within 1.5 times the height of the box. The circles are outliers (i.e., values that do not fall in the T-bars). The stars are extreme outliers (i.e., values more than three times the height of the boxes). Only AO shows a statistically significant difference between NM and MM.

