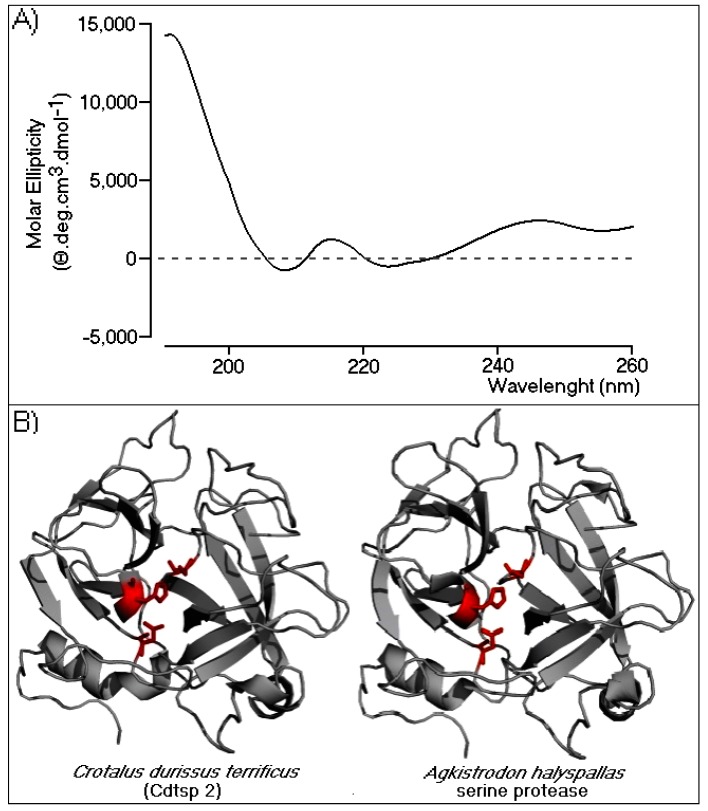
Figure 3.
Secondary structural analysis and a structural model of Cdtsp 2. (A) The circular dichroism (CD) spectral profile of native Cdtsp 2. The data were acquired over the range of 185–280 nm. The CD spectra are expressed in θ machine units of millidegrees in molar ellipticity (θ cm2/dmols). (B) Three-dimensional model of Cdtsp 2. The structure is represented by gray ribbons. The amino acids from the catalytic triad are represented by red sticks.

