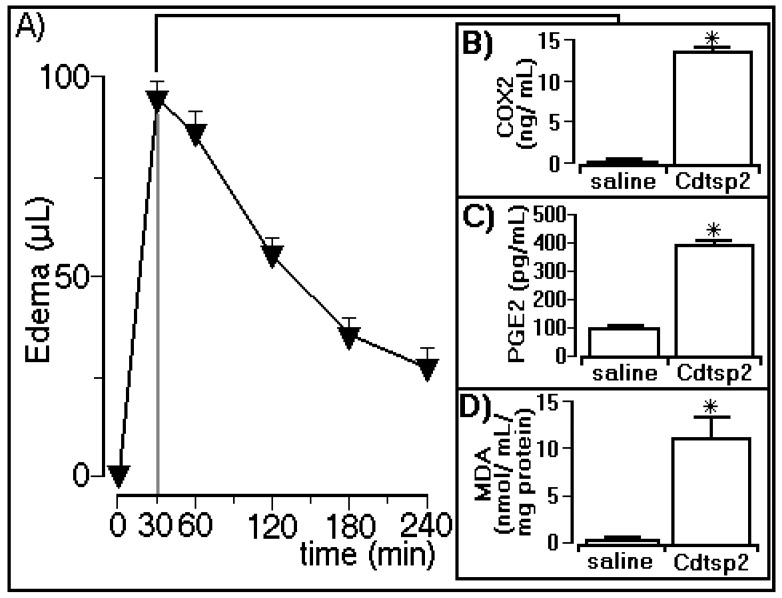
Figure 4.
Paw edema induced by Cdtsp 2, and corresponding levels of cyclooxygenase 2 (COX-2) expression, and prostaglandin E2 (PGE2) and malondialdehyde (MDA) concentrations. (A) Volume of edema induced by Cdt serine protease. Plots (B–D) show the results for COX-2 expression, and for PGE2 and MDA concentrations, respectively. The results are expressed as means ± standard deviation (n = 5). Significant differences are marked with (*) (two-way ANOVA with Bonferroni as a posteriori test; F = 150.0 and p < 0.001).

