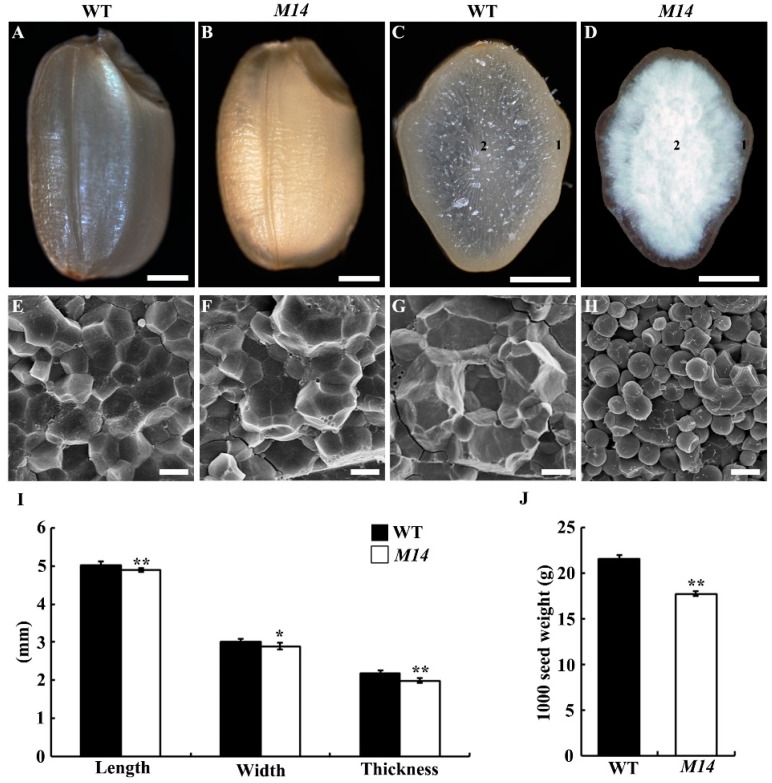
Figure 1.
Phenotype analyses of M14 seeds. (A,B) The appearance of brown rice of WT and M14. (C,D) Transverse sections of WT and M14 seed. Bars = 1 mm (A–D). (E–H) Scanning electron microscope observation of WT and M14 seeds. (E,F) represent the region of “1” and “2” in WT endosperm, respectively, and (G,H) represent the region of “1” and “2” in M14 endosperm, respectively. Bars = 5 μm (E–H). (I) Seed length, width, and thickness of WT and M14 (n = 20). (J) 1000-seed weight of WT and M14. Data are given as means ± SD (n = 3). ** and * indicate significant differences between WT and M14 at p < 0.01 and p < 0.05 by Student’s t test.

