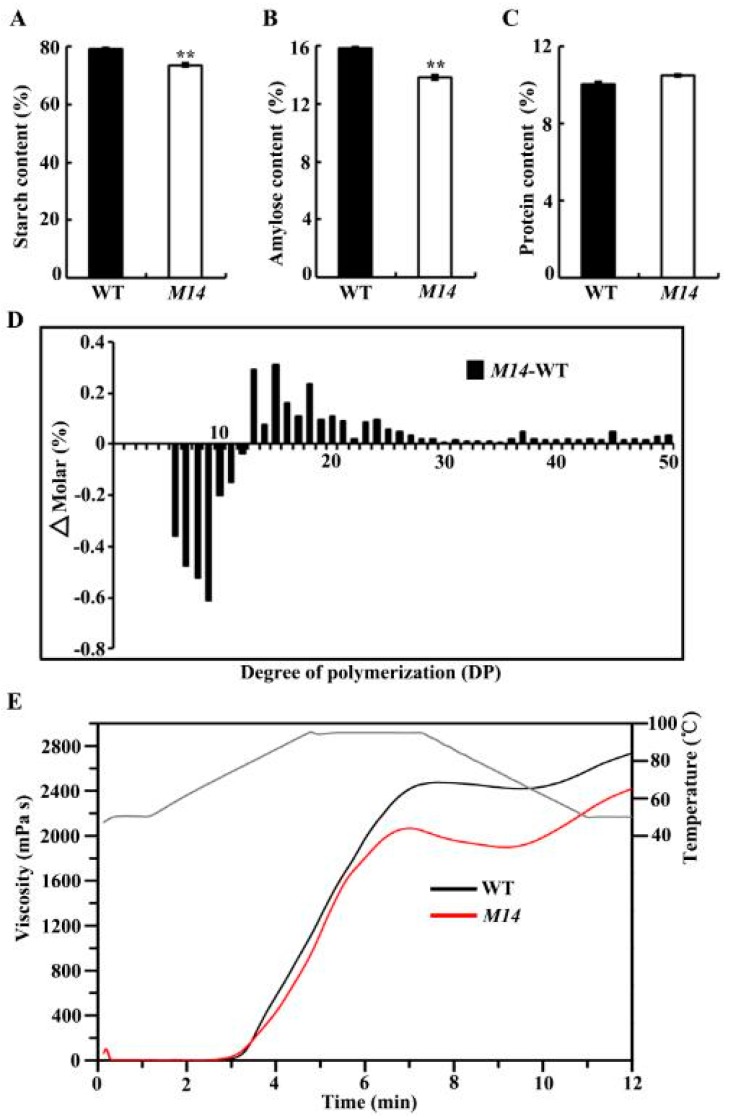
Figure 3.
Components of seed and starch and pasting properties of starch. (A–C) Starch, amylose and protein contents in WT and M14. All data are given as means ± SD (n = 3). ** indicate significant differences between WT and M14 at p < 0.01 by Student’s t test. (D) Differences in chain length distributions of amylopectin between WT and M14. (E) Pasting properties of starch from WT (black line) and M14 (red line) endosperm. The gray line indicates the temperature changes during the measurements.

