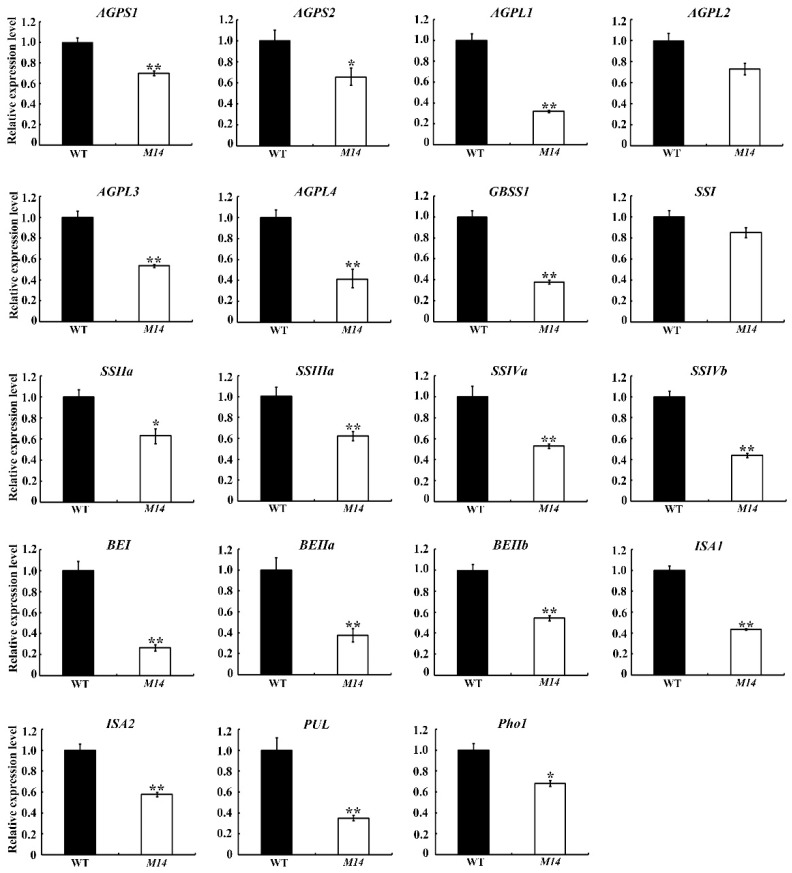
Figure 7.
Expression of starch biosynthesis-related genes in WT and M14. Total RNA extracted from 9 DAF endosperm is used for qRT-PCR analysis. ADP glucose pyrophosphorylase small subunit (AGPS1 and AGPS2) and large subunit (AGPL1, AGPL2, AGPL3, and AGPL4); granule-bound starch synthase I (GBSSI); soluble starch synthase I, IIa, IIIa, IVa, and IVb (SSI, SSIIa, SSIIIa, SSIVa, and SSIVb); branching enzyme I, IIa, and IIb (BEI, BEIIa, and BEIIb); isoamylase isozymes (ISA1 and ISA2); pullulanase (PUL); plastidial phosphorylase (Pho1). The expression level of every target gene in WT is set at 1.0. All data are given as means ± SD (n = 3). ** and * indicate significant differences between WT and M14 at p < 0.01 and p < 0.05 by Student’s t test.

