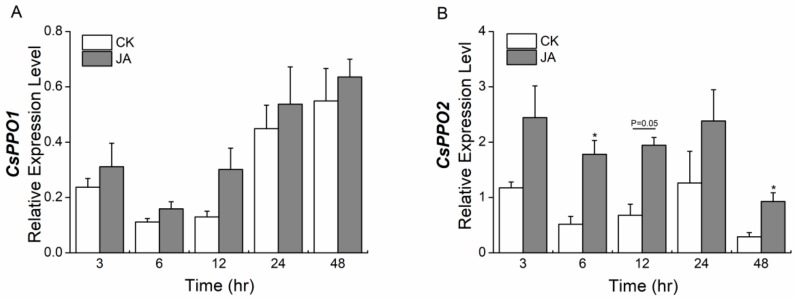
Figure 5.
Mean levels of transcriptional expression (±SE) of (A) CsPPO1 and (B) CsPPO2 in tea leaves of jasmonic acid (JA)-treated plants and control plants. CsGAPDH was used as a reference gene. The asterisks indicate significant differences between treatments and controls (* p < 0.05, Student’s t-test, n = 5).

