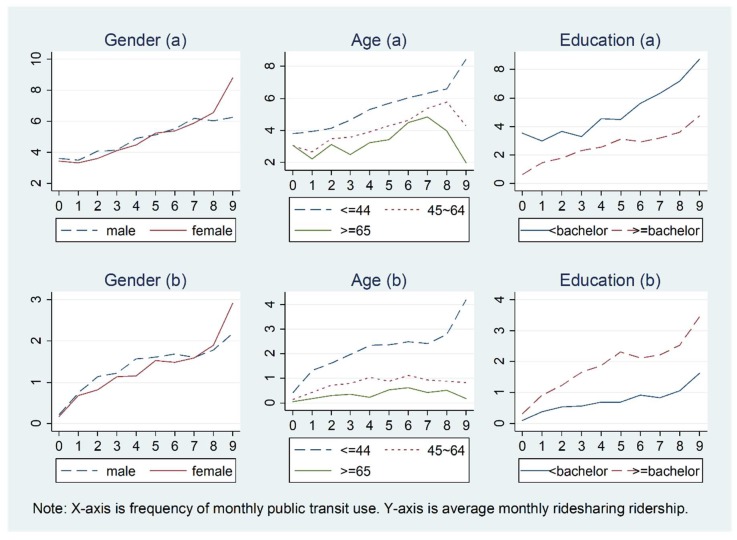
Figure 3.
Relationship between ridesharing and public transit use varying by gender, age, and education level for those who use ridesharing in the past 30 days: (a) 1–99 times; (b) 0–99 times. (for X-axis, 0 = 0 times, 1 = once, 2 = twice, 3 = 3 times, 4 = 4 times, 5 = 5 times, 6 = 6–10 times, 7 = 11–20 times, 8 = 21–30 times, and 9 = 31–99 times; the same for X-axis in Figure 4, Figure 5, Figure 6 and Figure 7).

