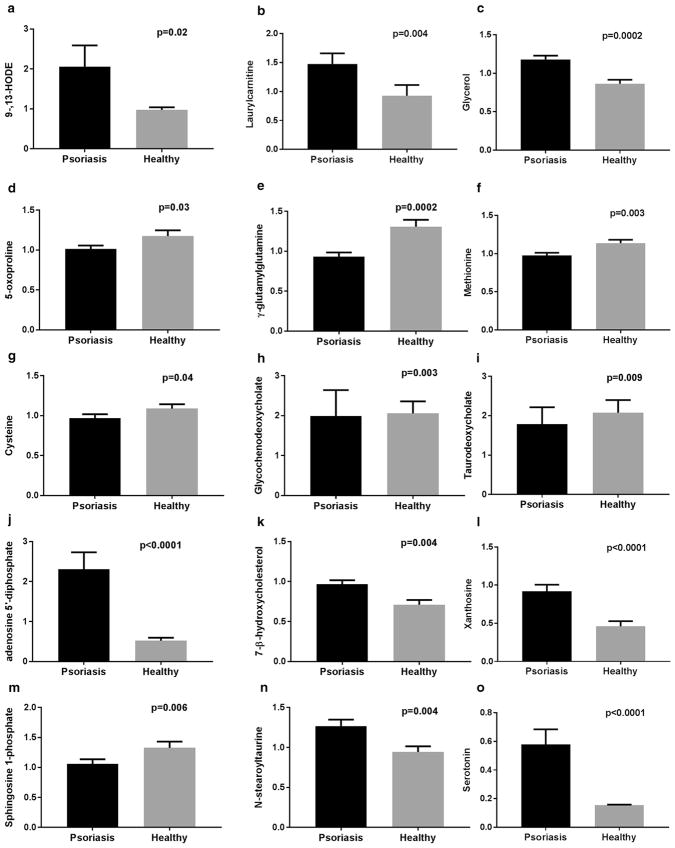
Figure 2. Representative biochemical profile of psoriatic and healthy plasma.
Fold change of key metabolites, (a) 9- and 13-HODE, (b) lauroylcarnitine, (c) glycerol, (d) 5-oxoproline, (e) γ-glutamylglutamine, (f) methionine, (g) cysteine, (h) glycochenodeoxycholate, (i) taurodeoxycholate, (j) adenosine 5′-diphosphate, (k) 7-β-hydroxycholesterol, (l) xanthosine, (m) sphingosine-1-phosphate, (n) N-stearoyl taurine, and (o) serotonin, were identified after ultra-high performance liquid chromatography and tandem mass spectrometry combined with gas chromatography/mass spectrometry (see Materials and Methods section for details). Values represent the mean ± standard error of the mean. n = 60 for the psoriasis group, n = 30 for the healthy group. P-values were derived from the Welch t test. P < 0.05 was considered statistically significant.

