
Figure 3.
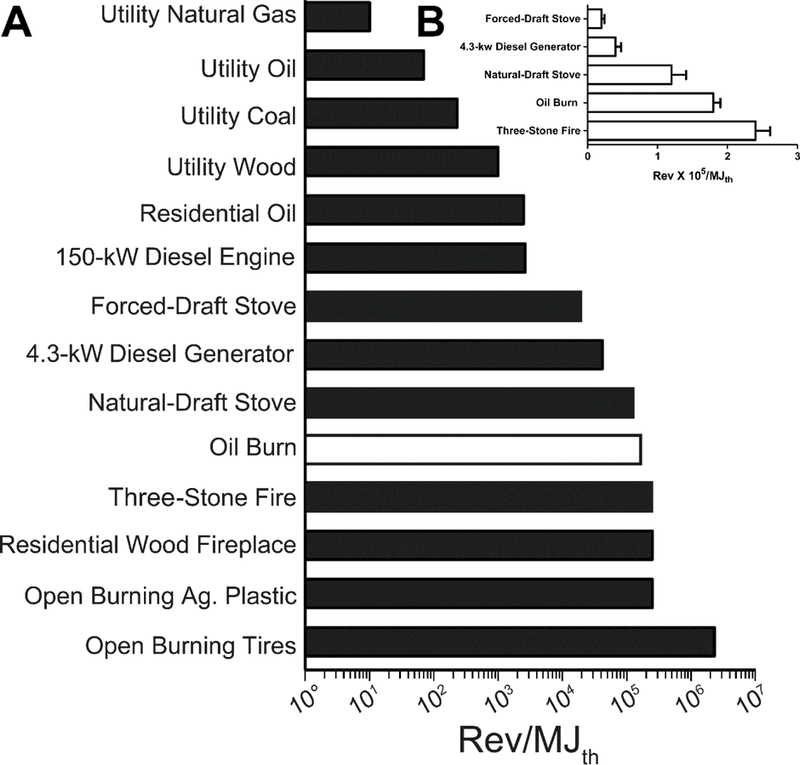
Mutagenicity emission factors in TA98 +S9 for a variety of emissions; data from Table VI. (A) Data plotted on a log scale; (B) subset of the data replotted on a linear scale showing standard error values; these mutagenicity emission factors were significantly different from one another (P <0.05).