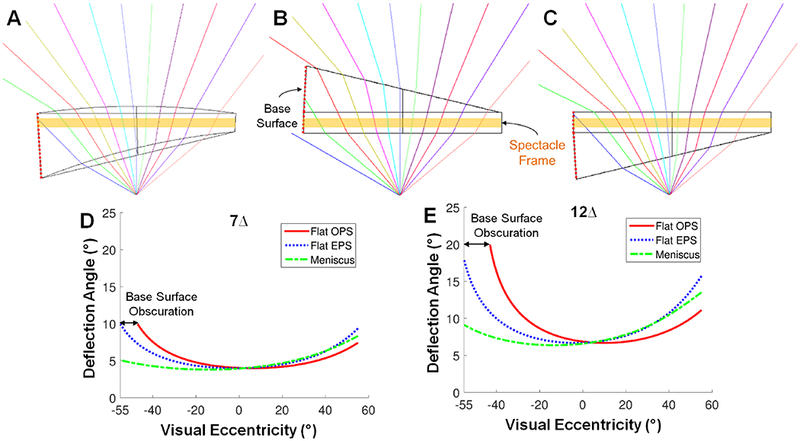
Figure 4.

Simulated optical ray tracing in full-field prisms and calculated effective prism power variation. (A) Meniscus, (B) flat outward (OPS), and (C) eyeward prism serrations (EPS) full-field prisms (12Δ). Colored ray tracings indicate visual eccentricities from −60° (left, base side) to 50° (right, apex side) at 10° intervals. The angle of incidence and range of visual eccentricities covered by the full-field prisms vary between the configurations due to the different back surfaces. Graphs show the effective prism power variation of (D) 7Δ and (E) 12Δ in each configuration as a function of visual eccentricity. The effective prism power in flat outward prism serration full-field prisms is higher than other configurations. However, the base surface obscuration hitting the base surface of the prism (red dotted surface) further limits the effective range of visual eccentricities in the flat outward prism serration.
