Figure 1. Association of rapid decline in FEV1 with incident cardiovascular disease.
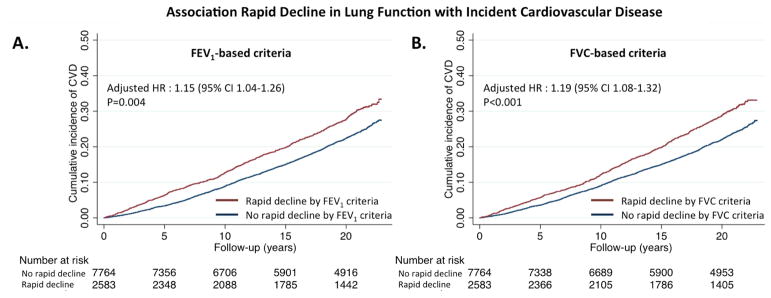
Rapid decline is defined as greatest quartile of decline in FEV1 over a mean of 2.9 years. Kaplan-Meier curves demonstrate the rates of (A) incident heart failure, (B) incident coronary heart disease, (C) incident stroke, and (D) the composite of these among the rapid decliner and non-rapid decliner groups. Hazard ratios (HR) and associated 95% confidence intervals are calculated from Cox regression models adjusted for age, sex, race, ARIC center, height, heart rate, body mass index, LDL-cholesterol, NT-proBNP, diabetes, hypertension, and smoking. For heart failure, a violation of the proportional hazards assumption was noted for this endpoint, indicated by the significant p for interaction for decline in percentage of predicted FEV1 and time with respect to incident heart failure. The Panel A inset shows the Kaplan-Meier curve restricted to the 1st year of follow-up. HRs are provided separately for pre-1 year and post-1year follow-up (indicated by dashed line), with associated P for interaction.

