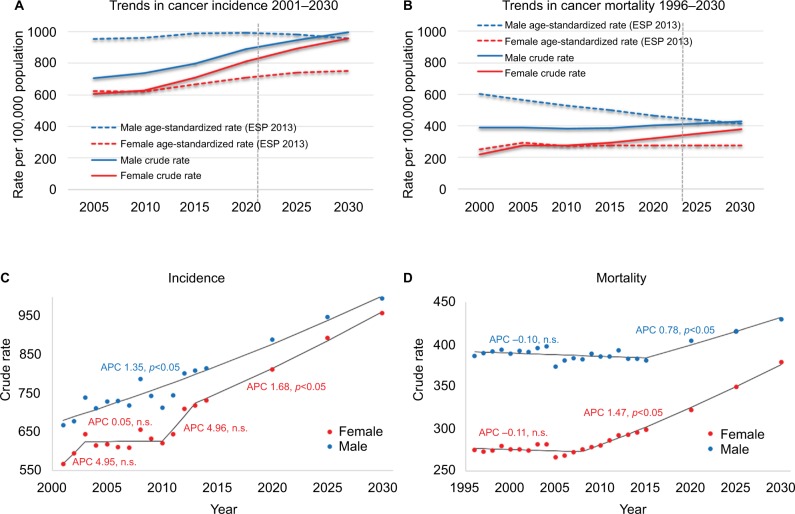
Figure 2.
Standardized cancer rates remain steady while a positive gain in annual percent change (APC) leads to increasing crude rates.
Notes: Trends in cancer incidence (A) and mortality (B). Male and female Hungarian crude rates of incidence and mortality are compared to age-standardized rates based on the 2013 European Standard population (ESP 2013). Solid lines represent actual data while dashed lines express data estimated by the age-period-cohort model. Every x-value represents a 5-year bin. Mean annual percent change in crude rates of male and female incidence (C) and mortality (D) modeled by joinpoint regression analysis. Positive APC values represent increase, negative values decrease in mortality rates.
Abbreviation: n.s., not significant.

