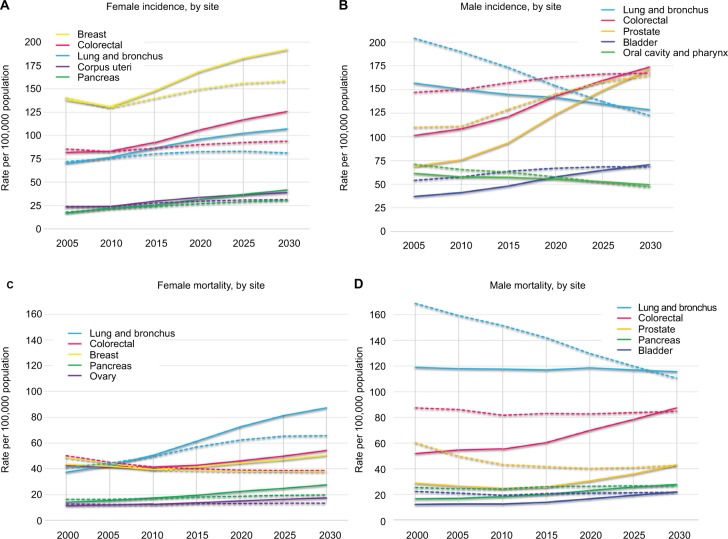
Figure 3.
Trends in incidence (A and B) and mortality (C and D) in the five most common cancers by sex.
Notes: Solid lines represent crude rates, dashed lines represent rates age-adjusted to the 2013 ESP. For 2020, 2025, 2030 data are estimated by the age-period-cohort model.
Abbreviation: ESP, European Standard population.

