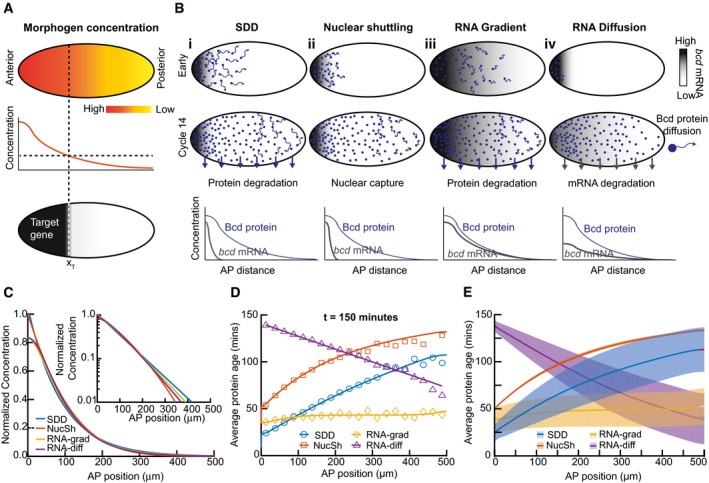
Figure 1. Protein age can distinguish alternative models of morphogen gradient formation with similar concentration profiles.

- Cartoon of the morphogen hypothesis: a spatially varying concentration of signaling molecule can result in precise readout of positional information.
- Outline of models considered. Morphogen RNA (grays) and protein (green dots) distribution are shown in early (top) and cycle 14 (middle) rows for each model considered. The magnitude of protein movement is represented by length of green arrows. Degradation of protein/RNA is represented by green/gray arrows. Bottom row shows a schematic of morphogen RNA and protein concentration profiles in cycle 14.
- Normalized Bcd concentration profiles for the models considered in (B) at time = 2.5 h. Inset: same on log scale. See Appendix and Appendix Fig S1 for extended discussion of models and parameters.
- Data points correspond to mean output of stochastic Monte Carlo simulation results for the average protein age as function of position, 2.5 h after initiation (see Appendix and Materials and Methods for details). Colored lines correspond to theoretical predictions for protein age in each model (Appendix Section B).
- As (D) but showing solutions over larger parameter space. Solid line represents mean solution, and dashed lines represent 1 SD. Parameter range described in text. SDD: synthesis, diffusion, degradation model, NucSh: nuclear shuttling model, RNA‐grad: RNA gradient model, and RNA‐diff: RNA diffusion model.
