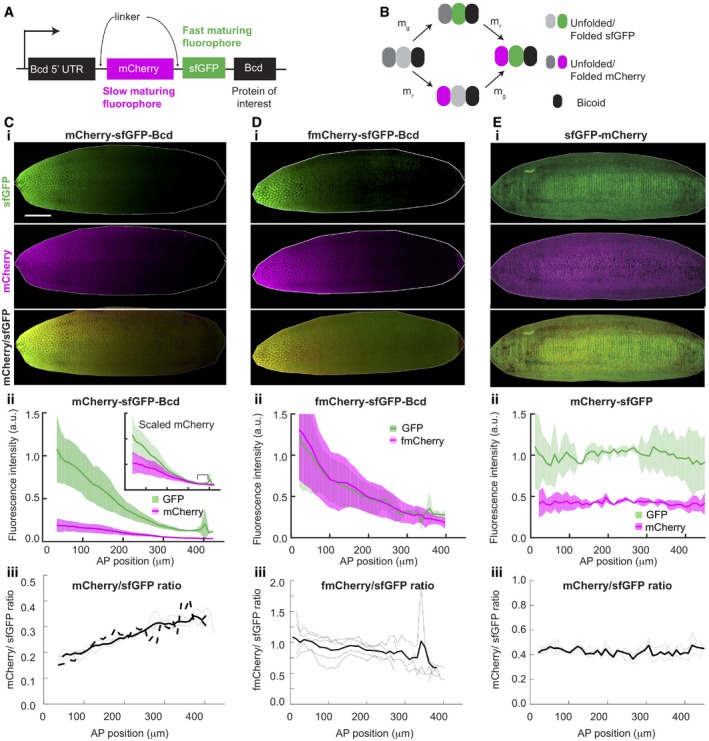
Figure 2. tFT‐Bcd reporter reflects average protein age.

-
ASchematic of tFT‐Bcd reporter with mCherry and sfGFP fluorophores.
-
BCartoon of the fluorescent protein maturation states in the tFT‐Bcd reporter. mg and mr represent the sfGFP and mCherry maturation rates, respectively (note, mr is an effective rate as mCherry has a two‐step maturation process).
-
C–EExamples of embryos expressing the tFT‐Bcd reporter with (C) mCherry‐sfGFP‐Bcd, (D) fmCherry‐sfGFP‐Bcd, and (E) mCherry‐sfGFP. For all, (i) images of “shells” of embryos in early n.c. 14. 3D images of the embryos were generated, and then, the interior of the embryo was erased, leaving only the embryo cortex to improve clarity (see Materials and Methods for more details). (ii) Mean AP intensity profile of each color for the embryo in (i). Shade region represents ± 1 SD. Inset shows same profiles after multiplication of red intensity by constant factor. Data binned into 10‐μm bins (n = 4 embryos). (iii) Ratio of green over red signal, reflecting protein age. The thin lines represent individual embryos, while the thick solid line is the mean. The solid dashed line depicts the mean green/red ratio for a line with the tFT‐Bcd reporter but lacking endogenous Bcd (BcdE1 mutant, n = 4. The scale is the same for all embryos. The scale bar is 50 μm long).
Source data are available online for this figure.
