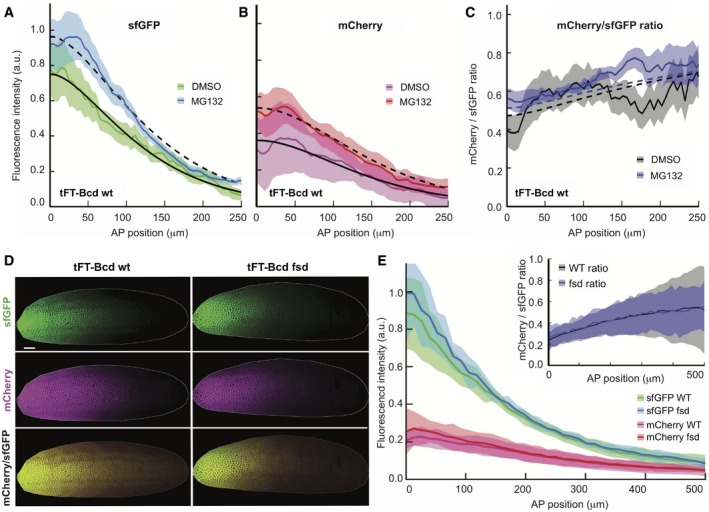
Figure 4. Bcd is degraded by the proteasomes in vivo .

-
A–CInjection of the proteasome inhibitor MG132 in embryos increases both the amount and the average age of Bcd (gray, open squares, N = 10). Control embryos were injected with DMSO (black, filled circles, N = 9). All embryos are y/w and were injected while in cycle 14 and imaged 60 min later. The shaded regions correspond to the mean ± SD.
-
DThe age of Bcd and its gradient are unaltered in fsd mutant. Comparison of a representative y/w embryo (left) and loss‐of‐function mutation fsdKG02393 (right) are shown. Both embryos have the tFT‐Bcd construct in the same locus, are in early n.c. 14, were imaged side‐by‐side under identical conditions, and are displayed with the same settings. Embryo “shells” as in Fig 2 are displayed. The scale bar corresponds to 50 μm.
-
EQuantification of embryos as in (D). Fluorescence intensity from sfGFP (green) and mCherry (magenta) for wt (N = 8, filled circles) and fsd (N = 6, open squares) at early cycle 14. Inset: tFT‐Bcd ratio for wt (black) and FSD (gray) embryos. The shaded regions depict the mean ± SD.
Source data are available online for this figure.
