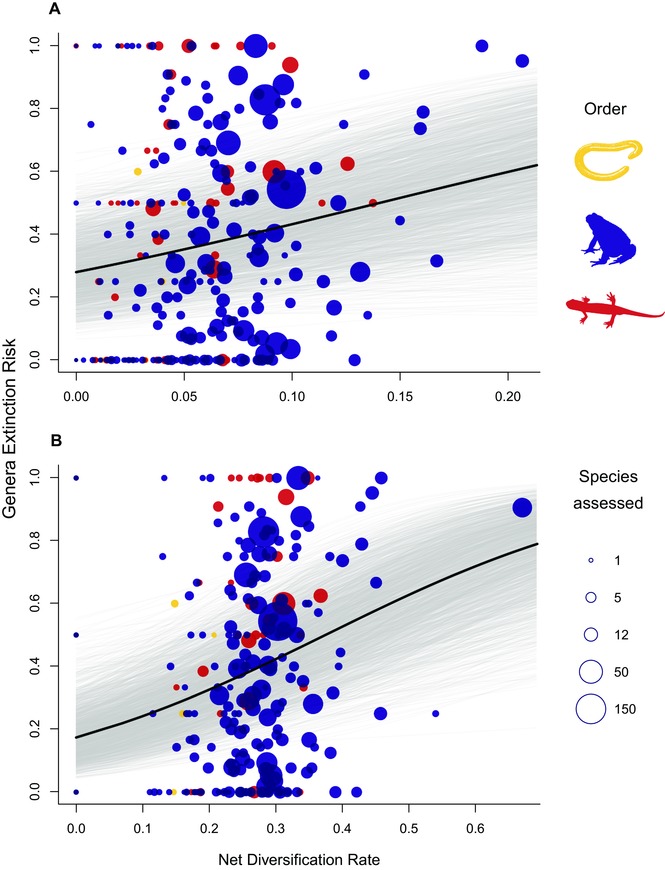
Figure 1.

Plot of the proportion of globally threatened species and diversification rate across amphibian genera, showing a positive relationship between extinction risk (proportion species threatened) and net diversification rate calculated using (A) stem age (n = 329) and (B) crown group age (square root transformed, n = 247). Gray lines indicate the fitted relationships (1800 samples) drawn from the posterior distribution of the models.
