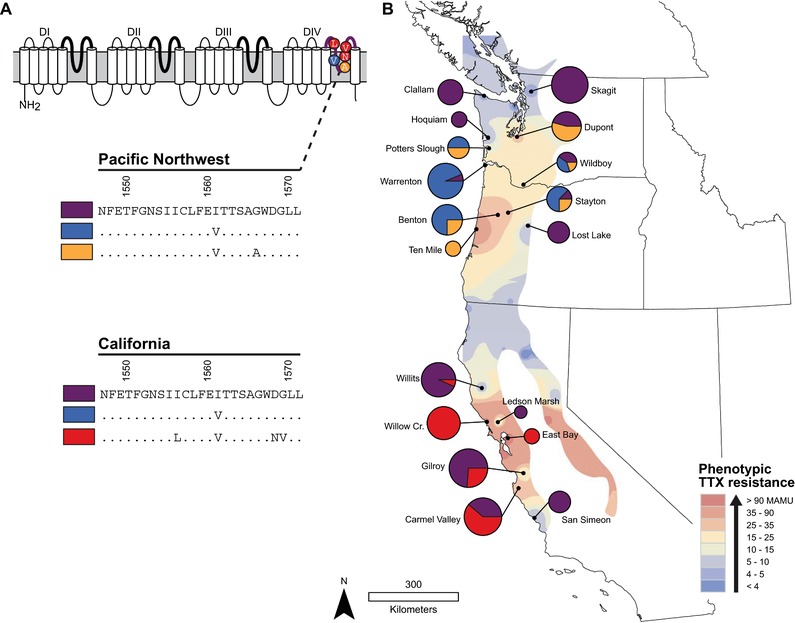
Figure 1.

Substitutions in NaV1.4 arose independently in California and the Pacific Northwest. (A) Schematic of the NaV1.4 skeletal muscle sodium ion channel in T. sirtalis. Each domain (DI–DIV) is shown with the extracellular pore loops (p‐loops) highlighted with bold lines. Specific amino acid changes in the DIV p‐loop are show in their relative positions within the pore. Below, the TTX‐sensitive ancestral sequence (purple) is listed for each lineage of T. sirtalis, in California and the Pacific Northwest, followed by other alleles found in each region that are known to confer stepwise increases in channel resistance. (B) Pie charts indicate the frequencies of different homozygous neonates for each population sampled from the two lineages. Chart size is proportional to sample size. On the map background, population‐level average phenotypic TTX resistance (50% MAMU) of T. sirtalis is interpolated across the geographic range of sympatry with Taricha newts (figure adapted from Hague et al. 2017).
