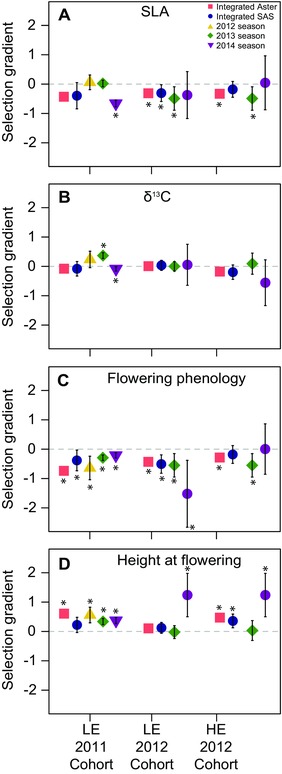
Figure 3.

Direct linear selection gradients from cumulative selection analyses in the 2011 and 2012 cohorts in the low elevation (LE) and high elevation (HE) gardens for (A) SLA, (B) carbon isotope discrimination (integrated water‐use efficiency, WUE), (C) flowering phenology, and (D) height at flowering. We show the direction and magnitude of selection from analyses integrated across years (Aster and SAS models) as well as from separate analyses for each season of study (SAS models). Estimating standard errors from Aster models is not straightforward. Thus, stars for integrated Aster models indicate significant selection as revealed by log likelihood ratio tests (Table S7–S12).
