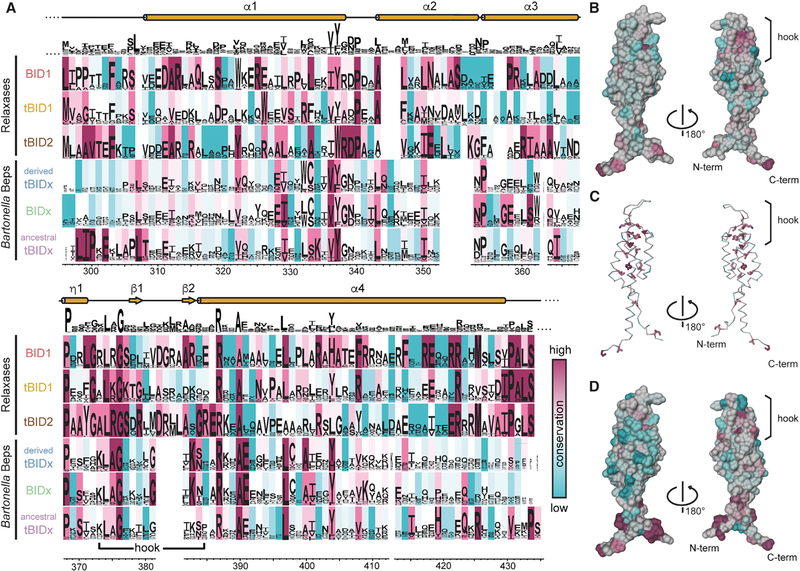
Figure 3. Conservation Analysis of BID Domains.
(A) Comparison of residue conservation in BID subclasses defined in Figure 2C. For each subclass, the sequence logo is shown and the background is colored using the ConSurf conservation color scale ranging from cyan to magenta for low to high conservation. An overall sequence logo is shown above the subclasses, indicating only a low amount of globally conserved residues.
(B and C) Overall conservation score mapped to the BroBep6_tBID1 structure. (B) Surface representation colored by overall conservation. The L374[A/R/K]G376 motif appears at the start of the hook. (C) Ribbon representation with conserved residues (ConSurf score ⩾8) shown as sticks.
(D) Surface representation of BroBep6_tBID1 colored by conservation of the BID domain in an ancestral tBID1 arrangement (last row of the alignment in A). The N and C termini appear well conserved when compared with the overall conservation shown in (B).

